22. October 2017
The 5 most asked questions
What everyone wants to know
What are the most frequently asked questions about Technical Analysis? I’ll give you the top 5 that I get during my speeches and courses on technical analysis. I've found there are some typical questions from a broad audience that are worth while looking at. Why don't we just jump right into it:
Question no. 5: “Where can I see the future price movement?”
This question usually comes from a guy that has been listening to most of the presentation, covering tools such as moving averages and RSI etc. But there’s something he doesn’t like, and at some point the frustration is simply too much and his question goes like this: “You keep talking about forecasting, but where can I see the future price movement? What you are showing me is just history, back in time. I'm not interested in that. You talk about forecasting, so please show me the future price”.
I have had that question several times. I was very puzzled the first time I got this question. I'm not sure I actually understood it. But later I heard it repeated in various ways, so I think I now get it. I felt it was a strange question. And I felt a communication gap that wasn’t easy to fill - like an English speaking person trying to communicate with a Chinese speaking person about how to get to the train station by going straight until the city hall and then turn right and then...well, you get the point.
Why this question?
This question no. 5 comes when I talk about "forecasting" and how a break above the moving average (just to keep it numbingly simple) is the forecast of an uptrend that will continue for a while. So the problem is that the person cannot see the future price. I only show that prices are "right now breaking above the moving average", and that this is a forecast that prices will continue to increase. The underlying accusation is that I'm saying that "prices will increase", but where can they see it? Hmm, how do you respond to that?
The whole problem was understandable if I just showed them one single example. In that case they naturally wouldn’t understand the significance of a break above the moving average. But I'm showing them example after example of breaks of the moving average (breaks above, breaks below, breaks that are followed with a strong price increase, with a weak increase and - finally - also false breaks that doesn't lead to an increase). So by this time I have shown so many examples, that I expect people to have at least a broad notion of what to expect. But some people just can't picture it in their mind.
What do I do?
What to do with such a question? Let's start with what I don't do any more. I don't say "Well, of course, I can't show you the future price, because it isn't here yet. It belongs to the future, so I can't show you the REAL future price. I can only tell you what I THINK will happen". I think this sounds reasonable, but when I say this, the man with the question turns purple in the face and mentally tune out. Not a good way to go about it.
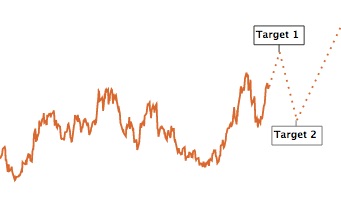
So what do I do? It’s quite simple. On the graph I make a dotted line into the future toward where I think prices will go. Oddly enough it works. It shouldn’t, but it does. See an example in the graph on the right. Some people simply can't picture the future trend. It is simply not in their nature, and they have not worked in this field, so how can we expect them to. For these people I show a dotted line into the future of what I expect to happen. And in all cases - so far at least - they are perfectly willing to accept a dotted line out to Target 1 and a dotted line to the next Target 2. They don't object to this, oddly enough, but are perfectly fine with it. They just need to see something tangible. Not picturing it for themselves.
I probably “should have” described possible outcomes and how we cannot say anything with certainty, because the name of the game is probability. But I would have lost them for good, way before I finish that. So with the dotted lines I’ve found a simple and tangible answer up front, crude and limited as it is. But it works. After showing the graph with the dotted line into the future it is much easier - later - to explain that the dotted line to Target 1 is not a fixed price, but rather a price range (from for example 1200-1600) and with a timing range (roughly aiming for a peak in Q3, for example). And a price range is also acceptable in the way that probability and uncertainty isn’t. In the end we are all wired a bit differently in the brain (slight variations on the same mainframe computer) and we just need to present stuff in a way that is more smooth and digestible. Your own wiring, for example, may need a slightly different angle, who knows?
Oh, and your question right now is "What are the other questions in the top 5??” The question I get the most are:
1. How accurate are your forecasts?
2. Should I buy now?
3. What if Technical and Fundamental analysis disagree?
4. What effect will XYZ (Brexit, the US election, any kind of upcoming hot topic) have on the market?
I’ll write the answers to these questions next time. Questions that we get time and time again are important. It shows how people think and what we can do to present it better. What is your deepest question?