5. April 2020
An extreme recession in 2020?
I will show you a recession in 2020, and I will show you a model that the old masters used.
“Mean” has different meanings, so it’s tricky in English. You can be mean to someone (which is bad), or you can “mean something to someone” which is very, very good. Today we will discuss a third option for the word “mean” as “A middle point between extremes”, as defined by Webster. We are simply looking for “the mean”, the middle point, the balance. Once you find the balance point, you can correctly understand all the fluctuations in the world of finance.
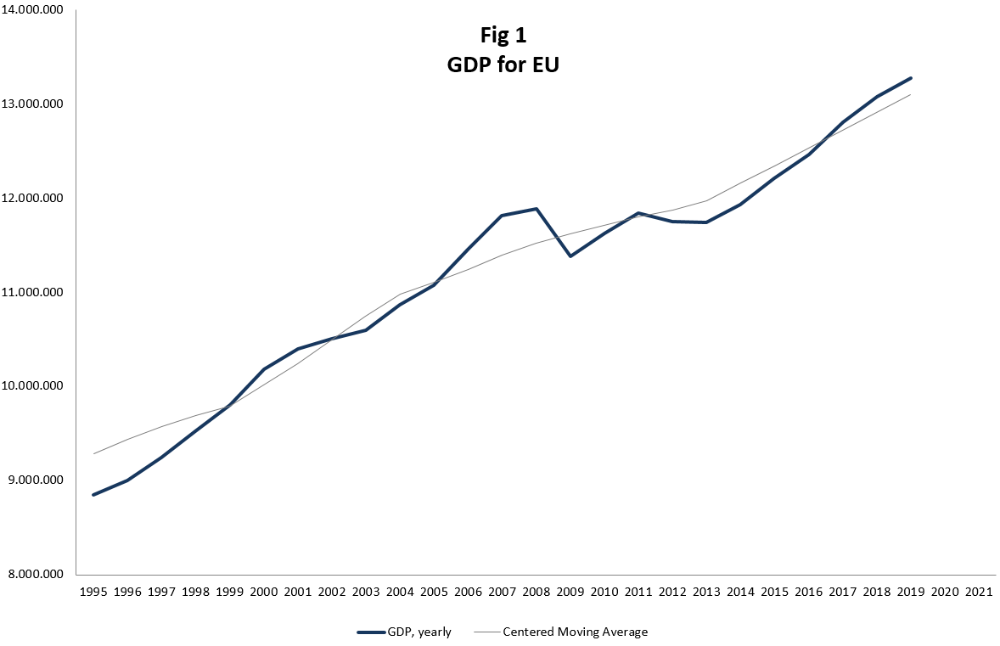
Figure no 1 is the GDP of EU. It shows an ever-increasing curve where the society gets richer all the time. That is the positive news, because this curve will continue to increase over the next 100 years as well. Society is richer today than it was just before the financial crisis, and this upward trajectory is nice.
Did you notice the grey line in the middle? That is the “mean”. The average. What can we do with that line? Notice how the GDP fluctuates “around” the mean. When the GDP is higher than the mean (like in 2008) we have a booming economy. When the GDP break below the mean (like in 2009) we have a bad economy or recession. In the graph it looks like very small deviations from the mean but believe me it is very significant. We will get to that in a minute.
How do we calculate the mean?
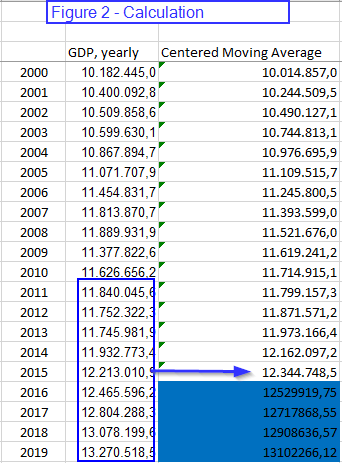
In this example we take 9 years of GDP and make an average. That is just adding 9 numbers and dividing by 9. But what do we do with this average? We place it “in the middle”, at number 5. That is called “Centered Moving Average” which is totally different than “Simple Moving Average”. The Centered Moving Average is a tool in macro economy that the old masters have used, whereas the Simple Moving Average is a technical analysis tool, and the way to use that is totally different.
We placed the average at year no 5. We now take another 9 years GDP from year 2 to 10, calculate the average and place it in the middle - at year no 6. And we just continue like this. This will create an average that is “centered”. See the Figure 2 for the calculation.
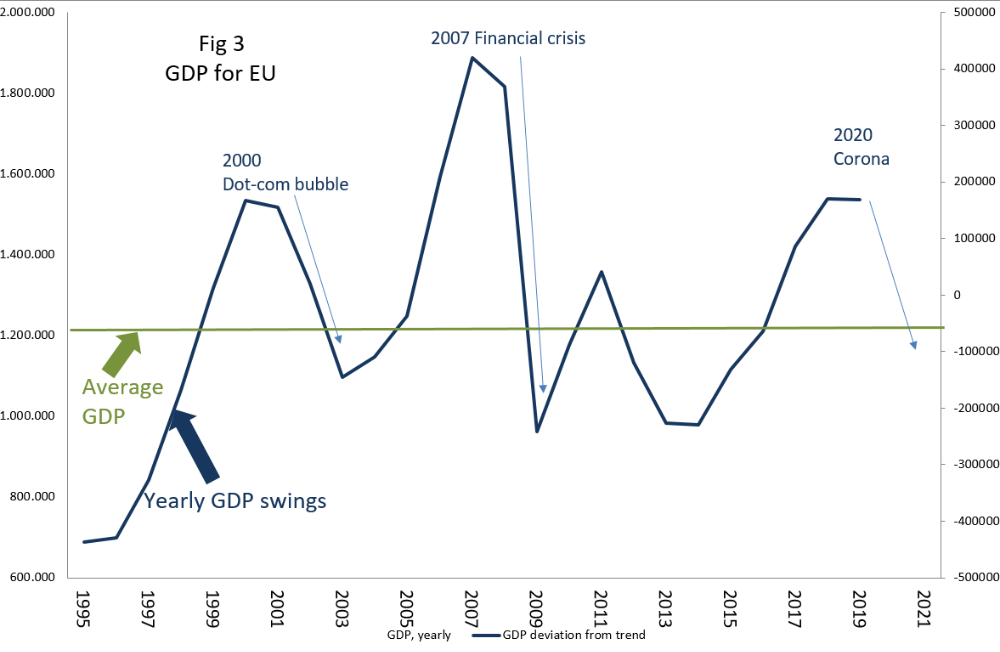
Figure 3 shows what happens when you subtract the GDP from the mean. Now we get very big fluctuations around the mean. Anything above the middle line is a booming economy. Anything below the line is a recession or at least a slowdown.
It is worth noting that the mean (the zero line) is horizontal in the graph. However, do remember that this line is actually increasing like you see in Figure 1. GDP and the mean will always increase on the long term. If you remember that, then you can mentally accept that here in Figure 3 the line is flat, horizontal.
A man and a dog
It is helpful to think of the economy as a dog on a leash. The man is “the mean” and he is walking straight along the path at zero. But the dog is sniffing around and sometimes it goes to the left (above zero) and sometimes it goes to the right of the man (below zero). There is a limit to how far away the dog can go because it is on a leash. The leash is made of rubber, so if the dog is really interested in sniffing at something it can pull more and get farther away from the man - but this can only last for a short while. At some point the dog must return to the man again. That is called Mean Reversion. The economy always fluctuates around the mean - both above and below.
Exteme zones
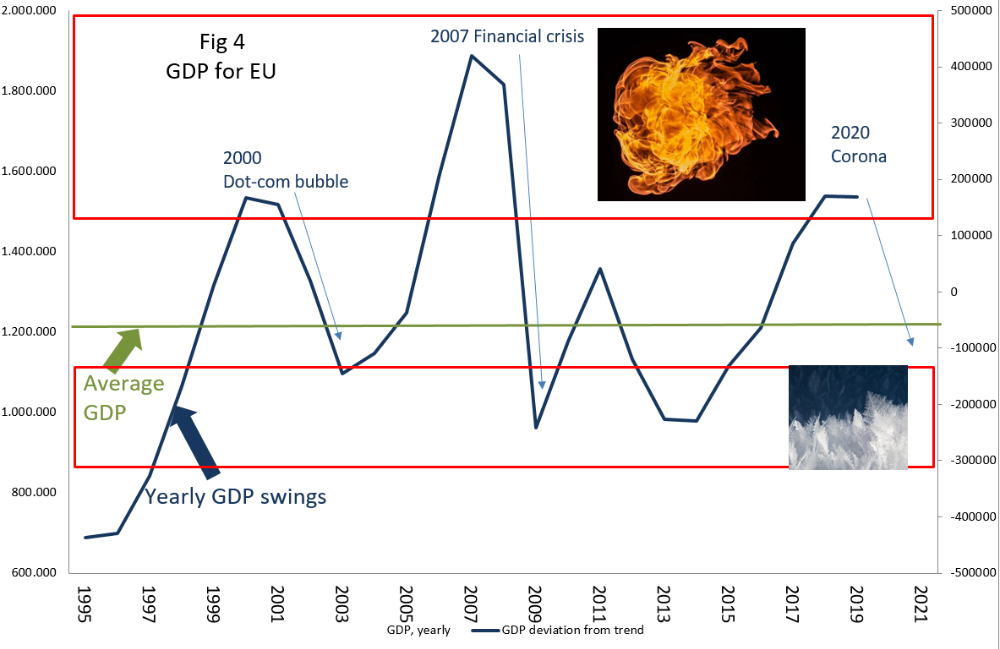
The economy has extreme zones where it cannot stay for long. These zones are marked in Figure 4. The top end is the “hot zone” where the temperature is too high. If the economy stays here for too long it will get cooked, and so it must retreat to the man at the middle. The lower part is the “cold zone” where the economy is freezing. If the economy stays here for too long it will freeze to a standstill and die, and so it must retreat to the man at the middle.
It is important to note how a visit to the hot zone is almost always followed with a visit to the cold zone. That is how mean reversion works. The economy is never at a standstill just like your breathing is never at a standstill (because then you are dead). The economy is not dead and so it has to continue to breathe - up and down - entering above and below the mean.
Making sense of it all
By now you can see how easy it is to see that 2019 (data for the complete year) is already in the hot zone. By definition it is just a matter of time before the economy has to retreat and start a decline into the cold zone. It is unavoidable. It is very seldom you have a tool that can say something as categorically as that. You cannot avoid a recession, and with this tool you now know it. No, you cannot predict exactly “when” it will happen. You just know it WILL happen. The “when” is another tool. The economy could well have increased further in 2020, going higher because of the dogs’ rubber leash, and then the recession would start in 2021. That is an option. The timing of “when” requires another tool (and I will likely go into that another time). But it is good to know that the economy in 2019 was very far away from the middle and that it has to return, and it was just a question of time.
Sugar tops
Many people are saying to me: “Well, you couldn’t predict that the Corona virus would hit and start the recession”. No, I could not. The “reason” for the decline is always different. That is why tops are always given a name. Just like every mountain is given a name like Matterhorn or Everest. The 2007 peak was called the start of the Financial recession. The one before that was the dot.com bubble. Every peak is given a name. I have said about this 2019 peak: “I don’t know what we will call this peak and recession - we just know it is coming”. My analogy is like this: Every peak is like a piece of sugar candy. They have different flavours - mint, strawberry, toffee. The main ingredient is, however, ALWAYS sugar. The taste might be different, but the content is always the same.
Funny enough, no-one calls the troughs anything. I think they deserve a name too. Just like the deepest part of the ocean floor is called the Mariana trench. I think the low point in the economy should be called something positive as to what made the economy increase.
USA
You may say that the EU data is too short to establish good hot and cold zones and you are right. Another time I will show the US zones, but there are too many graphs in this blog already.
If you study this method you get a sense - not a rule but a rough idea - that extreme hot zones are often followed by equally extreme cold zones. The harder you throw something up, the harder it will be coming down.
“We didn’t know”
After the final recession started in 2007 and 2008 we heard a renowned economist say in public: “We didn’t realize that the economy was THAT much out of alignment”. We marvelled at that statement. How could they not know? It was plainly evident. Not just in the EU GDP but also in the US. It literally screamed hot zone, and the dog had even pulled the rubber leash to its extreme. There could only be one outcome of that - but the economists didn’t realize that. Simply because they don’t use this method that I have just shown you. A brilliant method that I cannot claim to have invented, because it was used by all the old masters. Why not use it when it is so blatantly good?
A technical remark here at the end about something you may have wondered. When we make a Centeret Moving Average we don’t have the last 4 years of CMA data. We will only get the mean for 2019 in 2023. Naturally we don’t have patience to wait that many years, so we have to “prolong” the mean artificially in the last 4 years. That can be done manually by using the general percent increase, or it can be done much more mathematically by a Hodrick-Prescott filter. Perhaps we can go through this another time. You just need to know that the last 4 years to “now” is always a rough guide that can never be truly known, but can be assessed to an acceptable degree.
Are we heading to a recession?
Now to your questions:
Are we heading to a recession in 2020: From the graph, yes! It cannot be any different. It didn’t HAVE to be in 2020, but it was coming anyway, and the Corona virus was just the trigger for the avalanche to start.
Where are we heading? To the cold zone, of course. Just like we have seen over and over again. The GDP was in the hot zone but not in the extreme end, so we don’t necessarily have to go to the extreme end of the cold zone, but anything’s possible. We are, however, heading to the cold zone.
How long will this last: Remember, “timing” is another tool. This tool just tells us where we are going.
Will the economy recover again?: Yes, certainly. It always does.
Now take a break. Take your dog for a walk – and see how many times it want to crisscross from one side of the path to the other…