1. November 2015
"Are we there yet?"
When you're driving with your kids, you know the inevitable question is coming: "Are we there yet??". The same applies to the financial world. We always want to know whether we are at the top (or bottom) of this stock/interest rate/commodity etc. It's important for us, and we are curious at heart.
We can find out whether we are at the top or bottom by using an RSI/EWT combination. The Relative Strength Indicator is really good, but it cannot automatically highlight the top for you. I propose to use it in combination with Elliott Waves. As always my basic tenet is that you cannot view the world "in isolation", so you need to combine different indicators. The focus here is on RSI, but viewed from an Elliott Wave angle. The first warning is that I don't want to rehash all the stuff about "overbought, oversold" that everyone talks about. This is for beginners. I also assume that you know the meaning of divergence and hidden divergence in the RSI (but I'll will deal with this issue in another post sometime).
Relative Strength Index is really an amazing tool. In a carpenters tool box there are a lot of tools and he doesn't necessarily use them all to an equal degree, but he needs RSI on a daily basis. There are a few essential tools like a hammer and a screwdriver and RSI is one of these essential tools that you use almost in every job. So starting from here we go to level two:
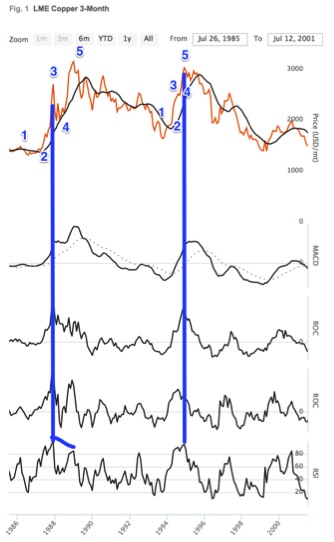
The problem: Sometimes a high RSI of 80-100 mean that prices are at a "final peak", but not always. How to tell? Because of "divergence" in the RSI we cannot automatically assume that a high RSI is the price peak and a low RSI is the price low. Unfortunately. That would have been a really nice trick if it worked like that. The problem is shown in the graph to the right. There are two different price peaks there, some years apart, and you can see an RSI at the bottom. The blue vertical line shows that the first RSI reading above 80 is not the final peak. A few years later we have a second RSI above 80 (blue, vertical line no. 2). But this time an RSI above 80 is the peak, the final peak. Bummer. Wouldn't it be nice if an RSI above 80 always meant that prices were at a peak?! So this is the problem. The first case shows a divergence in the RSI, whereas the second case doesn't. Divergence is a great tool too, but not if you don't know whether you will get divergence or not. So how to determine this in real time? Naturally the problem is "divergence" (single divergence or double divergence). The question I want to address is: "Are we at a final peak now, or do we expect an RSI divergence where prices make a higher high later?". The combination of RSI with Elliott waves can do the trick for you.
The solution: A rudimentary understanding of Elliott waves can help you solve the problem. The first RSI peak of 80 can be counted as a strong wave, but we have only reached the top of the 3rd wave. So following the Elliott logic we need wave 4 and 5. Sure enough this is what happened, and the RSI compensates by showing a divergence. So the high RSI of 80-100 does not imply a "final peak" but instead that "we are going to see the final 5th wave". In the second situation of a high RSI 80-100 we can already count 5 waves up and done. This means that we should not count on a 4th and 5th wave and we should not count on a divergence. Instead we should consider the probability that the RSI 80-100 means a final price top. Neat and simple solution.
Application: The solution to the problem is simple enough. I don't have to give you a disclaimer talk about possible exceptions, and that real life is more difficult than examples etc. You already know all of this, of course, because you are not a rookie. The only issue I want to bring to attention is that you need to know elliott waves. This is deceptively simple at first, but the complexity will soon start to dawn on you once you work with it. The trick is that you don't have to be an expert and know everything about Elliott waves. If you don't like Elliott, then get over it and read it anyhow. A fairly simple approach and a basic understanding is enough to solve the RSI problem mentioned here. Don't overdo it. If it's obvious, it's simple. If you have to squint at the chart and try to force an interpretation on it, you are on the wrong track. This RSI/Elliott combination won't work in all cases, but is likely to work in a majority of them. The whole idea of "combinations" is that the strength of one indicator solves the weakness of another. RSI is my main indicator here, and a very rudimentary understanding of Elliott Waves can remove an RSI blind spot.
Naturally this text is not only about a high RSI of 80-100. This applies to a low RSI of 0-20 as well, just in reverse. But of course you already knew this. If you like the RSI/Elliott combination, then in a later post I'll describe an Elliott/RSI combination - i.e. the reverse situation. It turns out that an Elliott wave problem can use the RSI as a guide. More about that in another post.
"So, answer dad! Are we there yet? I gotta pee".