28. June 2016
Brexit and the earthquake
how the stock market reacted to the Brexit, and a follow up on our forecast
It’s good to get the Brexit vote behind us. Not in a vain attempt to get clarity, because we are not naive enough to expect that (the vote to leave just raises a thousand more questions). But it’s good to have a decision so we can leave the incessant media noise behind us and get on with the agenda instead of everyone holding their breath.
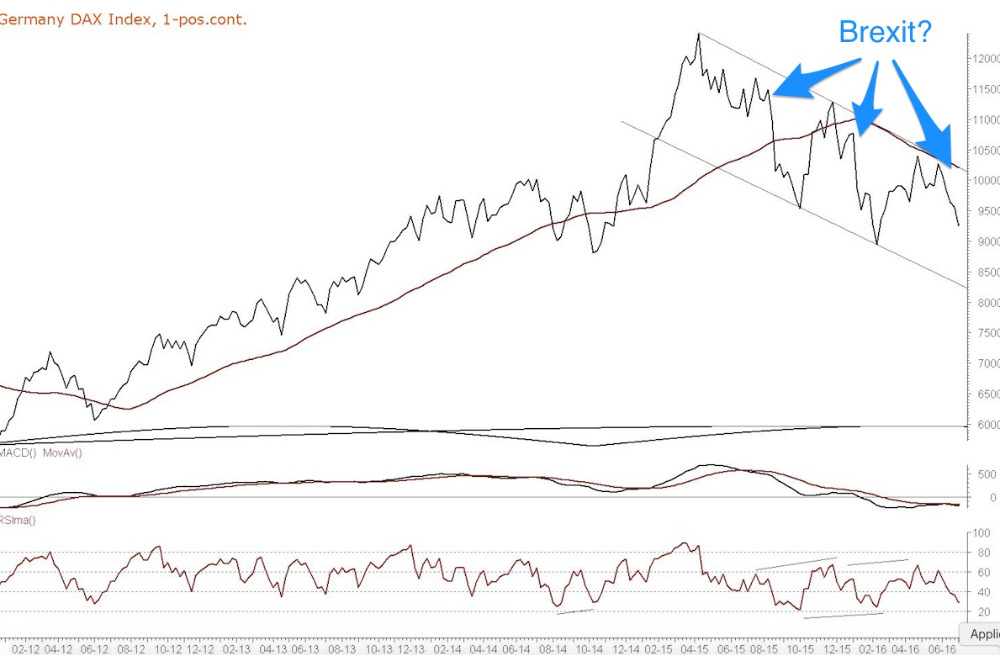
So what was the result of the infamous Brexit? The first graph has 3 arrows. If you didn’t know the date of the Brexit, when would you say it took place? I couldn’t tell you, that's for sure. To me these three places looks similar. Same volatility, same rate of decline, same old, same old. So in conclusion the Brexit vote didn’t really make an earthquake, just ordinary business as usual. The effect was in reverse proportion to the media coverage. Perhaps it took a toll on the pound, but the stock market certainly didn’t register any trembling on the Richter scale. Maybe there are some not-so-nice cracks in the surface of the building, but it is still standing.
Maybe I’m being a bit cynical but it’s usually when all the media is hyped up about a topic that it simply peters out with a small whimper and no effect. Let the experts warn about a tornado and move everyone out, and you’ll see a slight summer breeze. It is not that we don’t get it right - sometimes - but most of the time we don’t. Tornados happen when we don’t expect it, and I have a feeling that earthquakes don’t like media publicity. Instead, they like to creep up on you at night when you least expect it.
So what's the forecast now?
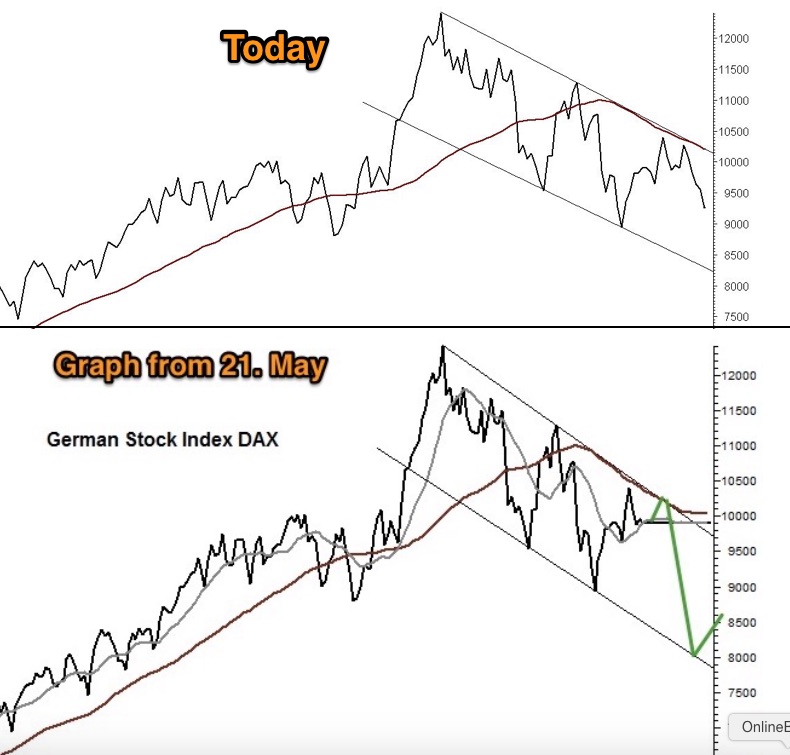
Let's follow up on our last forecast from May and see how it went. The last graph shows the original forecast from May (green line) and the current development in the DAX. It’s an astoundingly close match. If only I could do such a job consistently, then I would really be getting somewhere.
What did I do to make such a compelling forecast in May? Well, nothing much. I just used the KCT, The Kennedy Channeling Technique with two trendlines. The guidelines are pretty clear, and the price action has followed it. The basic idea was simply to consider the downtrend as intact as long as the DAX stayed inside the two trendlines.
So the question is: Will the DAX follow the green line and drop to the lower trendline? Well, I don’t know. A clear answer to a clear question. I don’t know. But the MACD is still below the signal line and the RSI still has a small distance to go before reaching a level below 20. This means that I could imagine that the stock market has just a little more to go before reaching a low point, so perhaps it will follow the green line to some extent. Perhaps with a summer low point. Again, only a break above the upper trendline is the cancellation of the current downtrend.