11. January 2020
DAX 2019 revisited - let's see how it went
A year has passed since my forecasting the DAX for 2019, and what better time to see how 2019 went than now in January 2020?
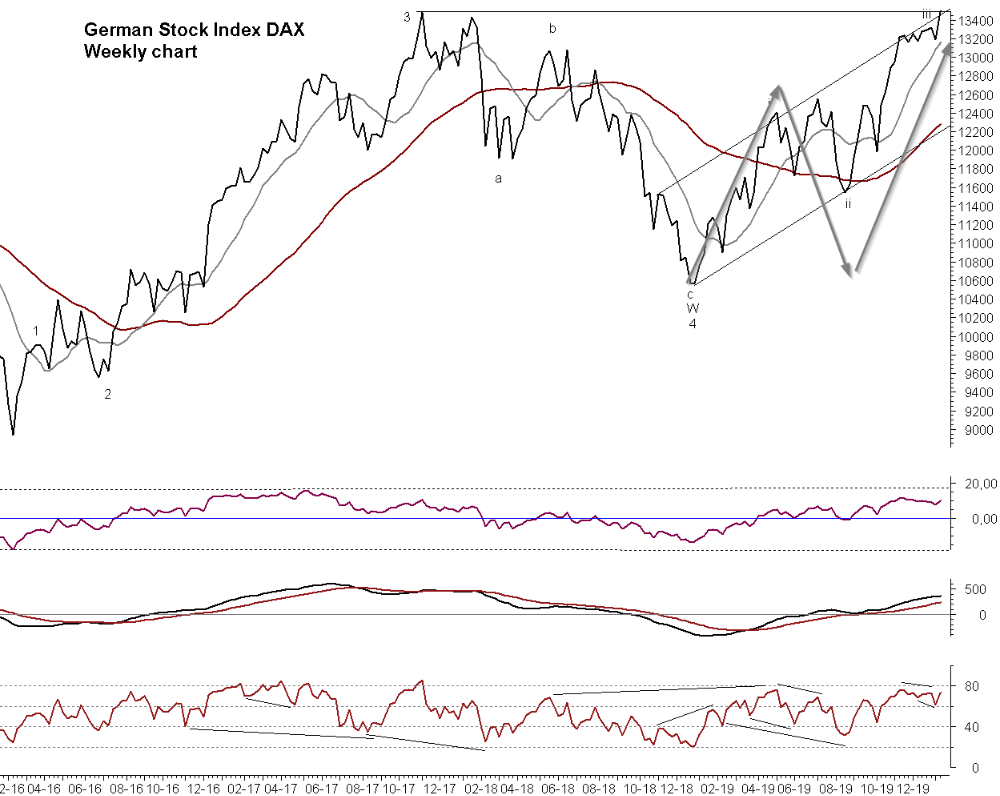
The grey lines in the graph on the right shows the rough scenario I painted in January 2019 (scenario 2, see the post), and now the real DAX movements are on the chart. Have a look...
How did it go? Well, not quite bad. It certainly wasn't perfect, especially the expected deep decline in summer that turned out to be a smaller decline - but a decline, nonetheless. The following increase is also quite spot on, but the DAX has clearly increased a bit more than the grey projection. But all in all I'm pretty satisfied with it. The astute Elliotician will notice that the labels have changed, giving a different perspective, or probability than the old. But then we are looking into 2020, and that is not the job today.
You may ask if I profited from this? Well, sadly no. I was busy doing other stuff, so I didn't really get around to trading the DAX. Looking at the graph I clearly should have, but that's the "fish that got away".
I like transparency. Try to follow up on your own research and forecasting and the learning will be worth it. I learned something from the less deep decline during summer, and the possible new Elliott wave count...and that you bloody well have to act on your own research, darn it! Now it is your turn...