12. December 2015
Fools rush in...
We are all fools. Rushing in with our analysis and interpretation. Where angels fear to tread. For the quote I'm indebted to Alexander, back in 1709. So, Dear Alexander, let me be the fool here and try to rush in. In a vain attempt to make sense of the stock market "right now".
The big question that everyone's debating is whether stocks have topped or not. One camp argues that stocks have topped and will turn into a real bear market downtrend - so sell all your stocks and get away. Another camp argues that we recently saw a short, downward correction that is over, and so the old uptrend can continue up, up, up for years to come - so buy, buy, buy. One of the camps will be right, of course, and the other wrong. It will be clearly visible not too far in the future. Let's try to "rush in" ahead of time and see if we can gain some perspective.
Angels really fear to tread here, and they have good reasons to. I enter in the middle of two camps throwing heavy stuff at each other, so my efforts will likely only land me a bump on the head for all my efforts. So a quick disclaimer: I have no vested interest in the outcome. I am frequently both short and long the market, so either direction is fine for me, as long as I get it right (which I don't always get). And I'm offering no buy/sell advice here. With that out of the way we can dive straight in:
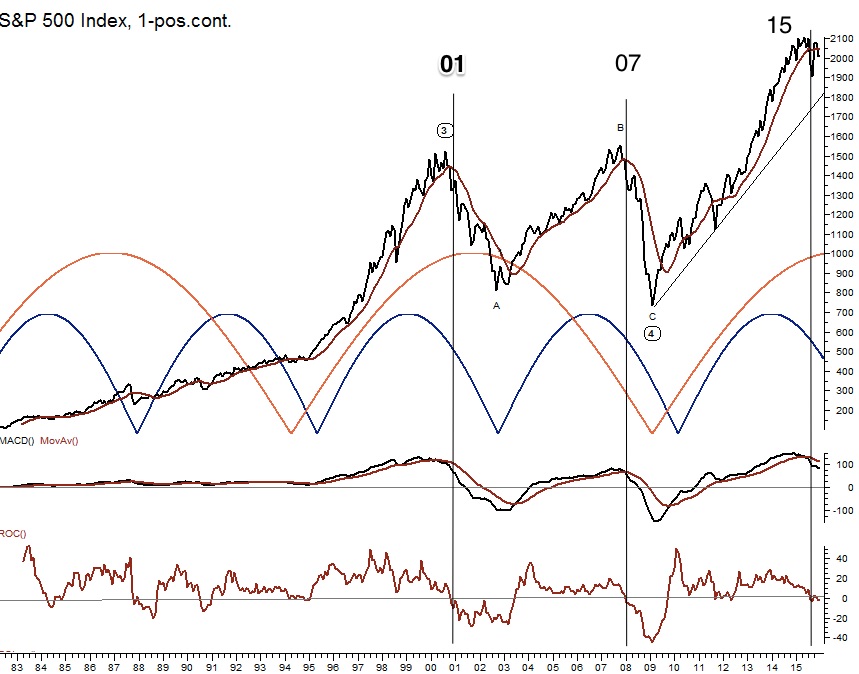
The first graph on the right is the S&P 500. Note the 3 vertical lines "01, 07, 15". In each case stock prices broke below the long moving average, below the MACD signal line and below a long ROC zero line. Normally a very clear and final sell signal. It happened here in 2015 just in the same manner as in 2007 and 2001. The technical analysis claims that this is a real downtrend. This is part 1.
Part 2 is fundamental and macro economy analysis. We are definitely required to make that. As always I demand (of myself) the fundamental and macro economy analysis to concur before I can act. However, it would be much too lengthy to describe such an analysis here in a short blog. Much to lengthy. So I won't even try. So let's call the outcome "unknown" for now. So we only have the technical analysis to go on.
There's two more technical tools in the graph that we can comment on. The two cycles in the graph are not valid, objective cycles (but that's the topic of another post). However, if we take them on face value (without leaning too much on them) it seems that the black cycle is definitely falling. This support the downtrend that the MACD and ROC argues for. The orange cycle is, however, not topping yet. This could be a "left translation" where the peak arrives "to the left" of the theoretical cycle. That would imply a really bearish situation for years and years. But don't jump to conclusions! Much argues for a potential "right translation" with a peak that will be higher than today (on the right side of the top). In that case we first need the index to descend like the black cycle indicates, and then reverse and make a much higher peak in perhaps 2017 or later (a higher peak than in 2015). So no objective conclusion and only speculation on the orange cycle, whereas the black cycle seems to indicate at least some real decline ahead - agreeing with the MACD and ROC.
You are also able to see some Elliott Wave labels at the peaks and troughs. We can discuss other possible counts another time. Other counts are always possible, so let's just use this particular count as a starting point. This Elliott Wave count argues that we are in the 5th and final wave. That is useful information, because that argues for a pretty long downtrend as an A-B-C movement. The problem is that I find it very difficult to count the subwaves up from 4 to 5, from the 2009 low. I can find several counts, and none of them are really convincing to me. What I don't want is to automatically take the most bearish count. That would be prejudiced from the other technical indicators that are bearish. So I'm looking for the least bearish count. In that case we "could" have seen a recent III top in 2015, and we are now heading for an A-B-C downward correction to IV. It seems we have seen A and B and we are now waiting for the final C wave down. This would be in line with the black cycle that points downward. So even a bullish count still looks for a final C wave down to IV, and somewhat deep, before a new increase to V can start.
The conclusion seems to be that all the indicators are pointing downward, and that we want to minimise our risk. There are two versions of how shallow or deep the decline will go, and we cannot objectively choose right now. We can speculate of course. But we simply have to follow the signals once we get lower. But we don't want to do nothing and "hope" all the way down.
A good question to ask to yourself is always: "Let's assume that in a few months the bullish camp clearly won the argument. In that case: What went wrong?". To flip the situation around is a really good exercise. If the bullish camp wins then the conclusion must be that all the technical signals gave a false signal. "It was a truly valid sell signal at the time, and all the models concurred, and we left no stone unturned, - but it was a fake break below". We cannot eliminate false signals entirely, unfortunately. But I don't want to place a bet on any situation being a false signal either. I will see it if we get a new break above the moving average, MACD and ROC.
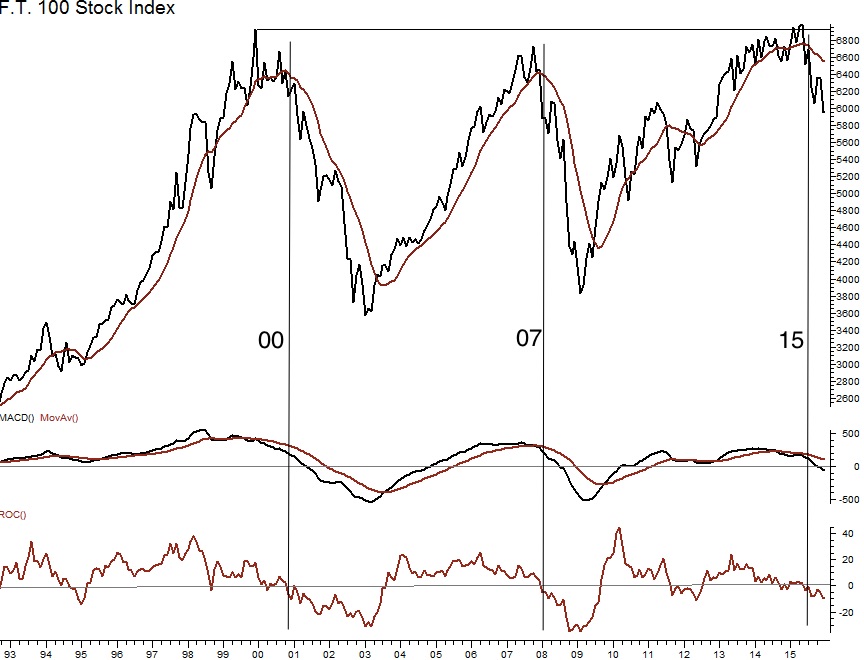
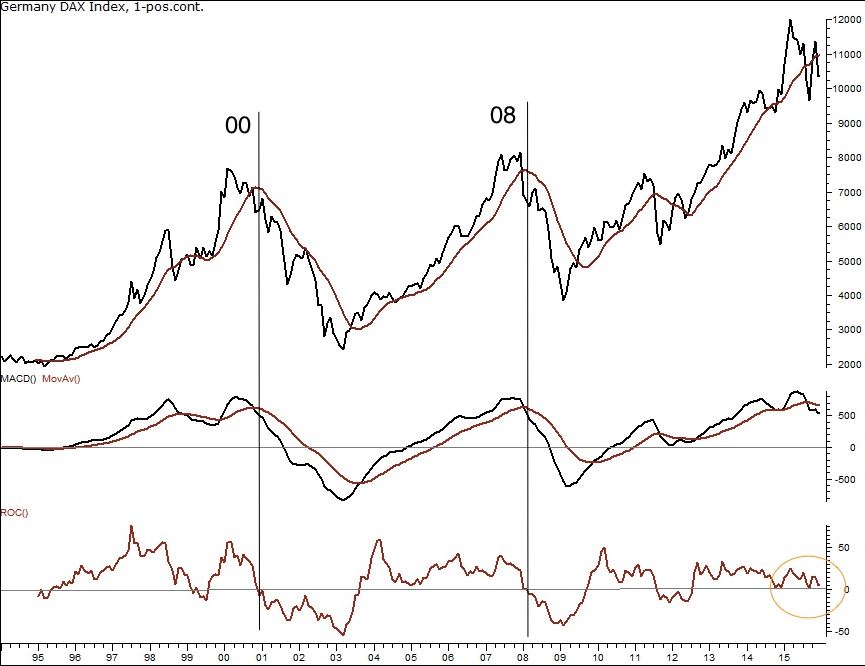
The FTSE 100 index (graph no. 2) also has all the sell signals. The DAX, however, does not. The MACD signal a downtrend, but the ROC does not (see the orange circle), and the moving average just show a tentative break below/above/below. That is more consistent with a sideways, unresolved trend. So the final call on DAX is not given yet.
The analysis here is not complete, but a blog post version only. We haven't discussed the business cycle analysis and the fundamental analysis. But we have shown a technical view and given some food for thought, and that was my main intention. Another intention was to use the "combination of models" (that I describe in other posts) in a real world application. The main point was food for thought.
At some point this post will be moved to "Archive", and be filed under either "correct calls" or "incorrect calls". We need to be fair and strict judges of our own analysis, and I'm looking forward to seeing which basket to put the analysis in. Because I'm not as wise as the angels.
This fool is signing off for now...