6. May 2016
How accurate are your forecasts? Tell me the truth
A look at the embarassing truth of market forecasts
If you are trying to lose weight, then the measuring tape is your friend. Don’t use the digital weight. It’s oblivious to any pleading and just gives you the cold digits. But the measuring tape, however, is like a dear friend that understands you. You can more or less get any reading you want, depending on how tight you are willing to pull the measuring tape :-)
I want to write about the measuring tape today. I am planning a post on “The top 5 questions I get asked about technical analysis when I’m doing lectures”. So you’ll get to know the answers without having to ask the questions. But instead of doing a count down from 5 to 1, I’ll skip over the suspense part and simply go to the number 1 question I get asked, over and over again. And it’s a very, very legitimate question: How accurate are your forecasts?
The answer is so complex that I usually say “I have a quick answer, and I have a complex answer - which one would you like?”. I don’t want to bog people with long-winded answers that tire them. I really believe in “Get to the point”. So the quick answer is that I’m 93% accurate. So there you have it. Pause. Digest. And that naturally means that I’m not 100% accurate. Don’t ever expect that. Nothing is perfect. If anyone tries to sell you 100%, then you have to run away as fast as you can, because it’s a scam. So I’m 93%, and this means there’s room for 7% errors. For some assets I have more than 7% errors and some have less.
Ok, so that was the quick answer. It’s true, but it's too simple.
An analyst once told me “If you give people a price target, then don’t give them a timing target. And if you give them a timing target, then don’t give them a price target. If you give them both, they will be able to track whether you were right or wrong, and you are not going to be able to hit them both anyway”. I don’t like that attitude. That comes from a scarcity mentality and from a cover-my-butt attitude. So I give people price and timing. You’ve got to tell people how you see it, and tell it clearly. That’s what they need. They understand that you won’t hit every target, but they need something clear for their planning.
So you now have to measure on two metrics - price and time.
When I measure, I come up with several accuracy percentages for myself. If you want a very strict measurement then I am 0% accurate. If I say “Oil prices will hit 48 USD on the 28. March” then I’m always, always going to be 0% accurate. Prices may hit 48 USD, but on the 29. March instead. Or the 28. March we saw a price of 46.5 USD instead of 48 USD. 0% accurate. So is this a good way to measure? Of course not.
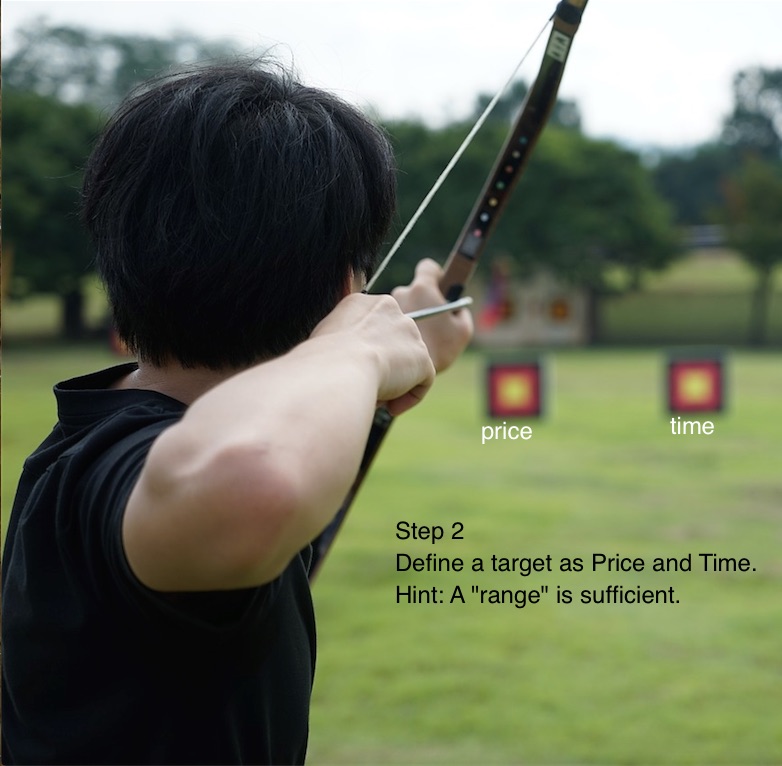
You can measure a range instead. Not aiming for 48 USD on the 28. March, you can aim for 45-50 USD with a March time frame. That will shoot the accuracy percent up sky high compared to 0%. I can also aim for the double range of 10 USD, from 40-50 USD with a Q1 top. Do you see? The bigger the scope I put up initially, the higher my accuracy percent becomes. So is that fair? It can feel like cheating, and its open for debate. But it’s not a problem. It depends on what you really need. If you are a daytrader, then you cannot use “Q1” at all. Even “March” is clearly too vague. If you are a company, you want to know what the trend is going to be, and Q1 is good enough. It doesn’t really matter what prices will be on the 28. March as compared to the 29th. What matters is that they know that prices are 27 USD today (say, in January) and during the next 3 months we are going to see an increase to 45-50 USD. So that enables them to plan how to cope with such an increase.
Another intricacy I often have: I have published a Target 1 that aims for an increase to 45-50 USD in 3 months time (naturally this is just an example). And then I get the buy signal, and I’m happy. When I get a buy signal I also get more data to make more calculations. So the data refines my target to not 45-50 but to 44-48 USD. And instead of 3 months I’m now thinking 2 months. So there’s a difference between my original forecast and the refined target. What was the end result? The final price turned out to be 44 USD and 3 months. Hmm. How to measure that? I didn’t meet the original 45-50 USD, because the real price ended up being 44 USD, but it was darn close. But when I made the hedge, the target was 44-48 USD. So was the target achieved or not? The length turned out to be the original 3 months, and not the 2 months refined target. So did I meet the target? What is my accuracy? Please tell me. Is it 0%? Is it 100%? Is it 50%?
But metrics don’t stop there. Should I calculate my accuracy based on my Forecast or my Signal? What’s the difference? If you are not painfully aware of the difference, then you’re in trouble. I have a Signal that prices are heading down now, and they have been falling for the past 2 months. So that is great and I’m on track toward Target 1. Then I have a Forecast, that prices will soon (not now, but soon) go up to 45-50 USD over the next 3 months, which is Target 2. Then I have another Forecast that prices will go down again to 37 USD over the span of the next 1-2 months, which is Target 3. Then I have a Target 4 and 5 etc. So if I measure my Signal, then I’m currently 100% correct. What if prices continue to fall many more months, and we never get the increase that my forecast of Target 1 claims? Well then my forecast failed. 0%. But then I never got a buy signal, because prices never broke above the moving average. So instead of prices going up, prices just continued down and down, remaining below the moving average. So in that case my Forecast was 0% correct, but my Signal was 100% correct. I didn’t go long (or I kept my short position, whatever your situation is). So there’s a huge gulf dividing signals from forecasts. The takeaway is - I only act on signals. I listen to forecast and I put them into my game plan. But I only act on signals.
If I want to see my accuracy at forecasts, then I can track all my Target 1’s. And that will give me a good accuracy. If I want to track my Target 2’s and 3’s - that are further and further out in the future - then my accuracy is naturally going to fall. The further out, the harder. So which target should I track?
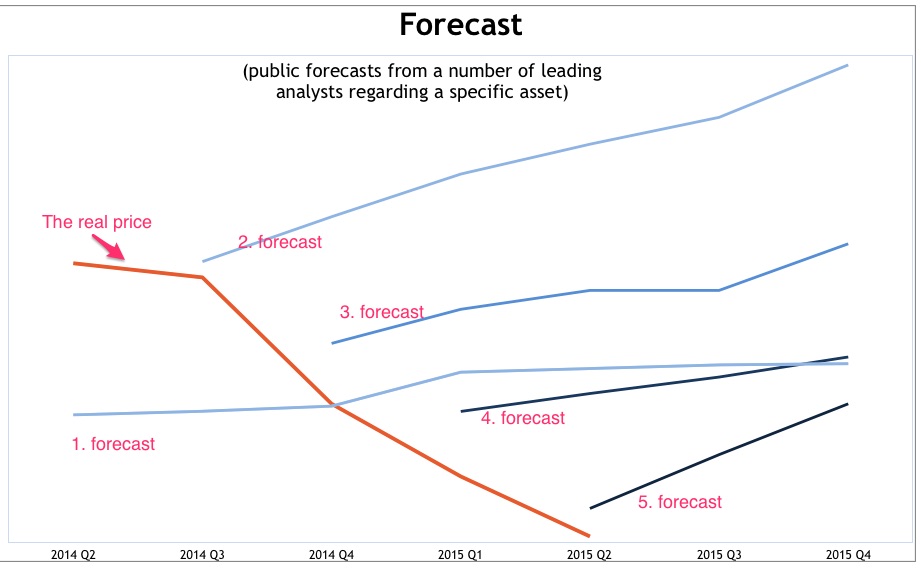
I want to show you a clear and concise conclusion of how I view accuracy. Stay tuned for that. I just want to show one practical example first. I want to show how others calculate accuracy. The graph on the right shows a forecast done by a list of known analysts and institutions, but I have kept the names out. I have all the details and data, and they are in fact publicly available. It’s just better to keep it as anonymous as possible, so I also don’t mention what asset we are looking at. Each quarter the analysts give a forecast on a specific asset. The graph shows their forecast no. 1, no. 2, no. 3 and it continues with a new forecast every quarter.
The graph shows how the forecasts developed. In my opinion the forecasts are jumping up and down with a staggering amount of revisions every quarter. Way, way too much, but that is just my opinion. It also shows the direction that they expected prices to take (always upward, so “go long”). The graph also shows the path that the real price took (always down). So go ahead and assign an accuracy percentage to that. Before you read on, please do a quick mental calculation and assign a percent accuracy. It doesn’t have to be precise, just a quick guess.
The shock comes when you see the forecast accuracy of the graph. It’s usually between 92-98% accuracy. Was that the same percent that you came up with? It certainly wasn’t what I expected. How can this be? Well, it turns out that they don’t cheat and they do everything fair and square according to the rules of how they want to calculate it. The forecasts are delivered at the start of every quarter. When the quarter is over they calculate how much deviation there was between the forecasted price and the price - at the end of the quarter. So it is a measure of a 3 months deviation. And as long as you agree that this is the way to calculate success, then you follow the rules. And you get a very nice 92-98% accuracy. Never mind that prices never goes the way that the forecast aims. Never mind that beyond the current quarter the results get more and more disastrous. Never mind that the action you do based on the forecast (going long in the market) produces a loss for you. Hmm.
I am often asked about my accuracy percent. A specific company did a review of my work and said that I was doing fine, but that their regular source had 92-98%. Yes, their source is the very same that you see in the graph. And yes, they invests heavily in the asset you see in the graph. And yes, they repeatedly lost money with these forecasts. And their conclusion was that my 93% was ok, but their source is already at 92-98% and that is slightly better. So what could I bring to the table that would be better? Hmm. Think about that the next time you want to compare track records.
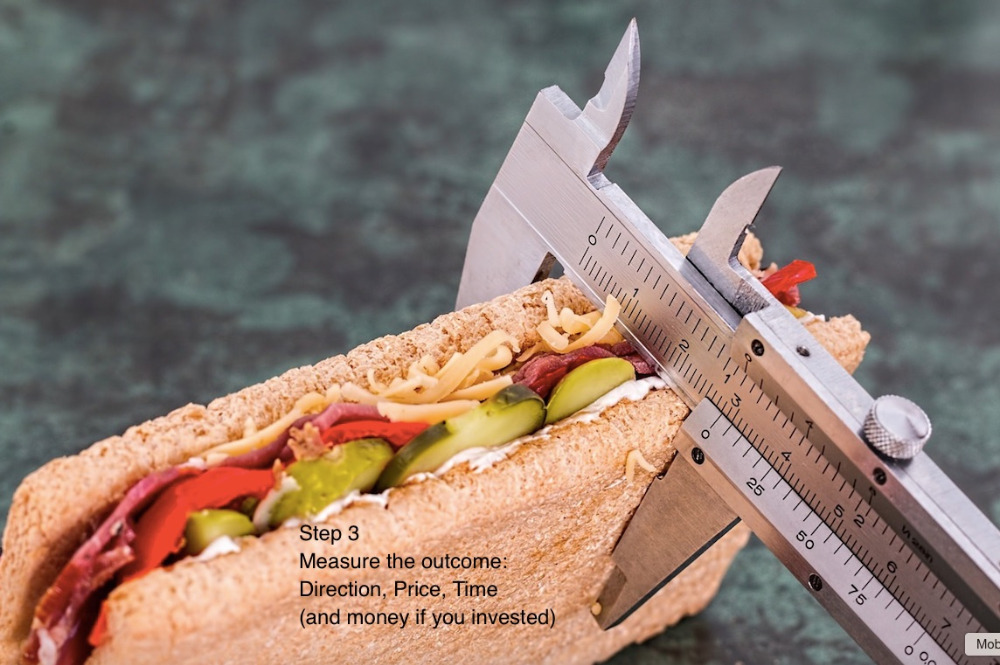
Let’s get to a conclusion of what I propose. Instead of making things more complex (which is what I have been doing until now), I want to make it clear again. Here’s where I boil it down to a specific goal and philosophy: What matters is my action and the outcome. That is what I want to measure. Tomorrow I get a break above the moving average (and a buy signal in the fundamentals etc. etc.). Then I have a signal, and then I make an action (I hedge or go long), and that will all have an outcome (do I make money or do I lose money).
So what I really, really want to do, is to track my signals, my actions and the outcome.
I put that sentence by itself, because in my book it is paramount. And I want to track that. So when I mention 93% accuracy that is because I track a signal that leads to an action and to an outcome. And that is 93% good results. That leaves 7% room for errors.
In the example we had before, the analysts had a 92-98% track record according to how they calculate the track record. In my book it doesn’t make sense, but as long as they publish how they measure the track record then we cannot blame them. I calculate differently. If I made a forecast like the example, then I would assign my result as being 0% and “losing money”. In their book the result is “92-98%” and they don’t measure the outcome. How convenient. The forecasted direction was an increase. Prices went down instead. That’s 0% in my book. The outcome (because you took a position) was a loss of money. Those two measurements I find useful. The rest is just playing with statistics.
“Playing with statistics” you can use MAPE (Mean Average Percent Error) or you can use MAD, GMRAE, SMAPE, MFE or Tracking Signal. When people start throwing these kinds of abbreviations around it’s just statistical “show-off”. And I’m highly and painfully allergic to an excessive theoretical outlook that is not based on common sense. But my point is: When you can measure it in different ways, be careful.
Here’s an example:
Prices are at 1,000 USD today and I forecast an increase to 1,200 USD. Instead prices fall to 800 USD. Basically I’m 400 USD off, and this means that my error is 50%. That also means that my forecast accuracy is 50%. That is total BS in my book. A 50% accuracy seems “not high, but decent”, but in reality it is a total loss. In my book I’m not 50% right, but I’m 100% wrong. That is how I feel about it, and statistics can be chugged and discarded. Urgh. I invested and made a 200 USD loss. What’s “50% accurate” about making a loss? So, my apologies to statisticians out there, but it's simply not common sense. And I'll take common sense any day of the week, not statistics. In my book I’m not 50% right, but 100% wrong. I think most people would agree with this - with the exception of statisticians, and forecasters that have an ego to protect. But those aside, I think that people who invest will agree. However, to play on a bit more even field, I assign such a forecast in my book as “0% accurate”. If the direction is wrong, then I'm 0% accurate.
Another example: We came from 1,000 USD and forecasted an increase to 1,200 USD, and we saw a tiny increase to 1,050 USD. In that case I’m 150 USD off, and the accuracy is 86%. But the success was 100% because the direction was right and we made money (just not as much as we had hoped for).
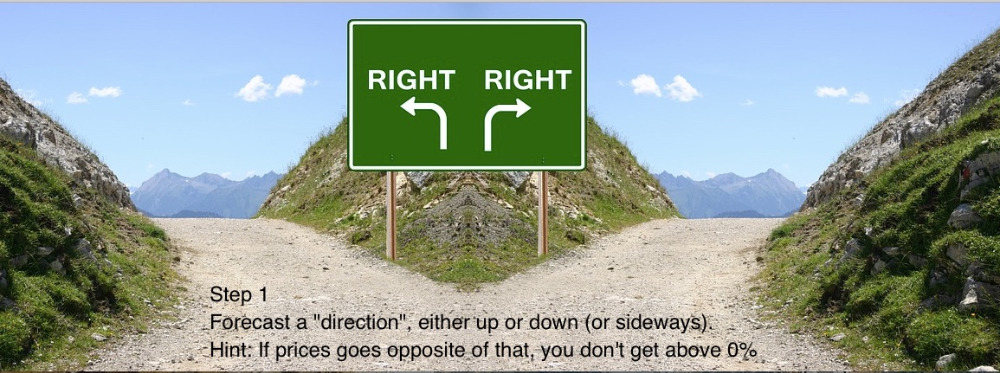
On the right I have 4 pictures of how I would like to measure accuracy. It's quite simple, but then again, I'm simple and I'm just after some common sense.
So it all comes down to how you measure. “Too loose” and you get a high score of 92-98%. “Too tight” and you get 0% because you measure against “48 USD on the 28. March”, which is clearly too tight. So I propose to measure Direction and Outcome. As you can clearly see now, you can get any percentage you like from me. If you want the accuracy of signals we are at 93%. If you want the accuracy of forecast Target 2’s, we are probably in the eighties. If you want the accuracy of Target 3’s, we are probably in the sixties, and if you want the accuracy on the 28. March then we are down to 0%. Any percent is doable. So my accuracy is anything and everything between 0% and 93%. In my book what counts is the direction and the outcome.
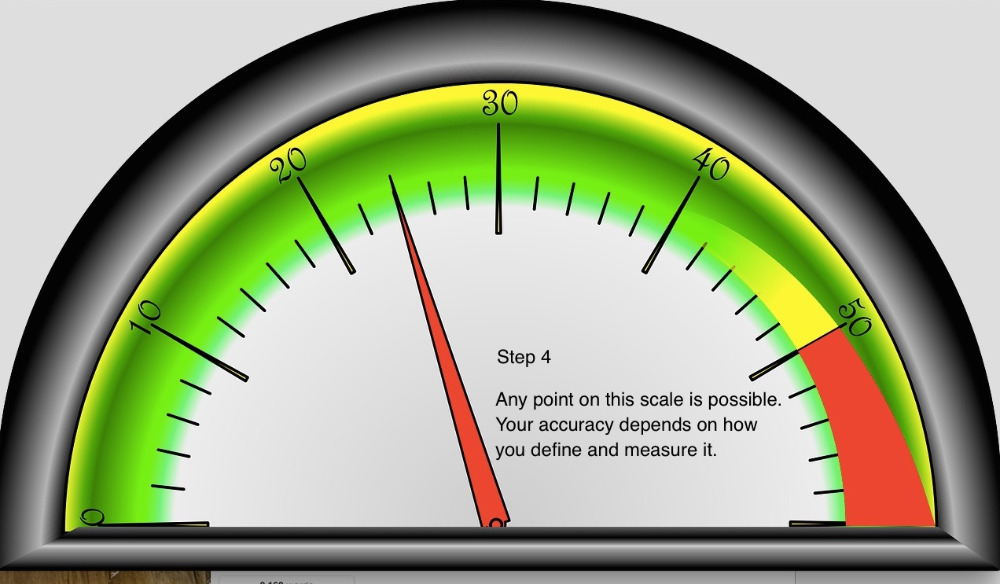
It all comes down to how much force you apply when you pull the measuring tape. Be sure to ask the next time you get a reading of the tape.