21. May 2018
"What is your track record" - part 1
Questions about my track record
What are the most frequently asked questions about Technical Analysis? I have already gone through the top questions 2-5, so here goes no. 1: “How accurate are your forecasts? What is your track record?"
This is a topic I really like. But it is also a big topic, so I will divide this into 2 posts. When someone ask about my track record, here is what I usually say at the first contact:
FIRST CONTACT
“I can calculate this for you, no problem. You just need to tell me which method you prefer. There are 7 generic methods - or at least I thought there were 7 methods in calculating a track record, but I have seen a few extra “creative” ways. I cannot have 7-10 track records going on at any time, so I just need you to specify which method you require, and then I’ll do the track record”.
I always find that the company don't know the methods and which to choose. So the answer I give is: “It’s quite simple. If you have a forecast provider today, or some publication that you follow, then you would want me to use the same method they do. That way you can compare apples to apples, instead of oranges to apples. Easy, right? So what method do they use, and what is the track record of your current suppliers?”
If you are advanced in this business, you know I’m setting them up. I have to admit that, sorry. Because naturally they don’t know the track record of their current forecast supplier. And they certainly don’t know the method they use to calculate the track record. In all my years I haven’t seen anyone that are able to answer this question. But they should be able to answer it - if they asked their supplier. So at this point I’m saying: “Well, that’s curios. It is important to get a track record from me, but you don’t have a track record from your current supplier. How come? This means that I can give you any number, whatsoever, and you don’t have a clue whether this number is high or low, good or bad. You have nothing to compare it to.” In all my years I have yet to see a track record (with one exception, and that is a story in itself).
THE TWIST
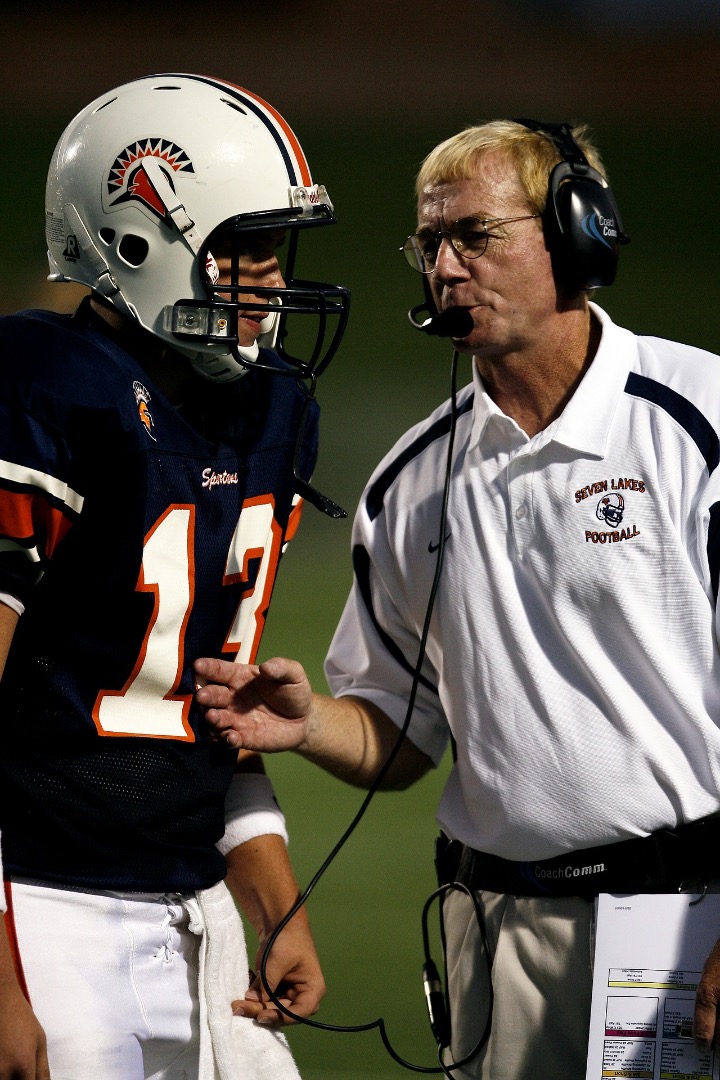
So, at this point I give it a twist: “It is ok that you don’t know the track record of your current forecast provider and the publications you follow. The job of the publications you follow is to act as a “football coach”, making you a better team and perform better. So their job over the past years have improved your game, so we should simply look at your own track record now. What is your own track record, and which method do you use? That way we can compare yours and mine. If your track record is much higher than mine, then you know that you don’t need to employ my forecasts. They will only drag you down. So let's compare. What is your own track record and how do you calculate it?”
By now you know the “twist”, because I have yet to see a track record from a company. They simply don’t track this. In essence this means that they don’t know their own track record and they don’t know the track record of their forecast supplier and publications. And they have nothing to compare with when I come with my numbers. Wow! But they want to appear “knowledgeable and critical” by asking about my track record.
You now get the twist. That is why I have a lot against track records in general. What I have done instead is to go into the company and calculate their actual track record, and then I use the same method for my work - and then we can compare. This makes sense because it is comparable - oranges to oranges.
FUZZY
I am assuming that when we talk about track record we have something tangible to measure. But many times we have something fuzzy instead. This is described by Peter Sainsbury (on the website “Materials Risk”): “Part of the problem is the fuzzy language in which many predictions are often expressed, making it difficult to tell if the forecast was right or wrong even after the event”.
According to Peter Sainsbury there has been a survey conducted by Author Michael Maubossin how people viewed forecasting language. What does it mean if there is a “serious possibility” that something happens. Is that higher or lower than “high probability”? What about “almost always”. A lot of these words are surveyed and measured. But these intangible, fuzzy words are a problem because you cannot make a track record. An example of this is shown here with a quote from CNBC:
“Geopolitical tensions will keep oil prices elevated heading into the summer driving season, but the energy market could be on track for a tumble in the second half of the year, according to....”.
Here the only tangible thing we have is “could”. Prices “could be on track to”. It’s hardly a forecast. And “could be on track for a tumble” is a question mark of what “tumble” is and for how long.
IMPRACTICAL
Fortunately the “fuzzy word problem” is not too big, because many forecaster use perfectly measureable words: Price + Time. Once you have those two components you can make a good track record, right? Or maybe? How about this:
“The EIA forecast that WTI oil will average $71/b in 2018 and $66/b in 2019”.
Here we have price and time, so you should be very satisfied. We are now in May and oil prices are at 79 USD, and you now have the EIA forecast for 2018, “average of 71 USD”. Is this of any use to you? You can measure the forecast (only once 2018 is gone), but it really doesn’t quality as a forecast that is practical and user-friendly here in May.
CHANGING FORECASTS
Now we go one step up in quality. We eliminate the fuzzy words, and we make the forecasts practical by showing “Price + Time”. So now it should be all right. Or is it:
Oilprice.com wrote in 2018: “At the end of February, 15 investment banks polled by The Wall Street Journal raised their oil price forecasts for a fifth consecutive month, and those banks now expect Brent prices to...”.
So as the forecast has been amended 5 times in 5 months, do we measure their original forecast or their new forecast? Or their 3. iteration? Our problem is what to measure when the forecast is changed. It would be absurd to demand that forecasts remain unchanged, because the world and input data change all the time. But on the other hand, if you can change your forecast 5 times and keep moving the target, then we sort of lose the purpose of the track record. Should we track the first or the last forecast?
INCOMPREHENSIBLE
One variant of forecast is the technical analysis. You should think I like them because I’m a technical analyst, but I don’t. I actually can’t stand them. This is just an example:
“The chart suggest an attempt to test the resistance level near the area of 79.50 and continue falling with the target below 75.70, the cancellation of the ....(a few technical words omitted)... will be a strong growth and breakdown of the level of 80.00, which will indicate the continued growth in the area above the level of 82.00”.
What you have just read is a real forecast by a technical analyst, but I don’t have a clue what it means. Maybe you are smarter than me, but I don’t know what to make of it. Are we aiming for a decline to 75.70 or an increase to 82.00? A lot of forecast are written in this way. I don’t understand it and I cannot measure it.
ALTERNATE SCENARIOS
What if you gave two forecasts at the same time - which is very common: “The aim is a price increase to 82 USD into Q2, but a break below support at 77 is the start of a decline to 72 USD”.
If the price today is 78, and it goes to 82, then your track record is great. But should it fall from 78 and break below the support at 77, then you also have a good track record because you forecasted a decline. So in one sentence you have forecasted both an uptrend and a downtrend and get good scores if both happen. No matter what happens your forecast turn out great. Now that is a nice feat! So what to do with “alternate scenarios”? How to measure a track record?
Or what about a specific forecast that ends with “but this based on OPEC keeping their current production cut”. So if OPEC changes their production cut a month later, then the forecast is invalid. Should we then count their forecast into the track record or delete it?
PITFALLS
I think I have managed my goal in this first blog about track record (stay tuned for the second part where I will show my track record). You are now seeing nothing but pitfalls. What started out by being "simple math" in making a track record has turned into a nightmare of fuzzy words, impractical forecasts, changing forecasts, incomprehensible language and alternate scenarios. That is why I am sceptical when people are so happy to embrace track records. First of all there are so many pitfalls. Secondly, they are mostly done “to look good” and to sell a product - not aiming at showing the true strength and weakness. And thirdly they are requested by people that want to seem knowledgeable, where they in fact have nothing to compare it with. I don’t see any winners here. Nothing but extra work and inflated egos on both sides, without any scientific integrity.
What I like instead, is to go to the company and find their “true track record” and compare apples to apples with my track record. This reveals where they are already strong and where they are weak. Do we find that they are strong in uptrends, whereas they make all their mistakes in downtrends? Or is it the other way around? So the companys own track record is what a “football coach” can use. Then the forecasters own track record should be calculated in the same way, so we can compare and see how much we potentially could lift them (realising, of course, that past performance is no guarantee for future performance). “You own track record is at XX over the past 3 years, and we can potentially lift that to an area around YY if we work specifically at the weakness that we find in this and this area”. That is real, that is tangible, that is result driven. That is thinking like a football coach that want the team to win.
Stay tuned for Part 2.