2. January 2016
Rockets & Bumpy Roads
This is the 2. January 2016, saying goodbye to 2015. Fifteen was not a "Bumpy Road", but it feels like I have been travelling quite a long time on the roads. I liked fifteen, though. And then suddenly it's over and I've got to meet and shake hands with sixteen. I hope it is "Sweet sixteen"...
I want the first post of the new year to be about Rockets and Bumpy Roads. In reality this is a way of looking at the markets. It's a perspective that has helped me a lot, so I want to share it.
The claim is that markets consists exclusively of Rockets and Bumpy Roads. Just those two things, and nothing else. The final conclusion is that it always has to be crystal clear to you whether the market is in a Rocket mode, or whether it is in a Bumpy Road mode. It requires only very little study to understand the two modes, but it will make a big difference in the way you look at the market moving forward.
Rocket mode is when the market is trending fast. It can be uptrends or downtrends, but the movement is fast. Elliott waves call this "an impulsive wave". The Elliott Wave Theory has in my opinion researched this concept the best, so credits are due. I just like the word Rockets better because there's explosive energy behind it, just like you see in the picture on the right.
Bumpy Roads are when the market is driving leisurely along winding roads. You spend a lot of time there, but you don't get anywhere fast. You cannot really see the direction clearly because the roads are winding left and right and you can't see around the next bend. Elliott wave theory call this "a corrective wave". I like Bumpy Roads better because it shows the twisting nature of the roads, and that it takes a lot of time to travel with an unclear direction. But the movement always goes "against" the direction of the previous Rocket mode. It is also a "pause" before the Rocket mode continues.
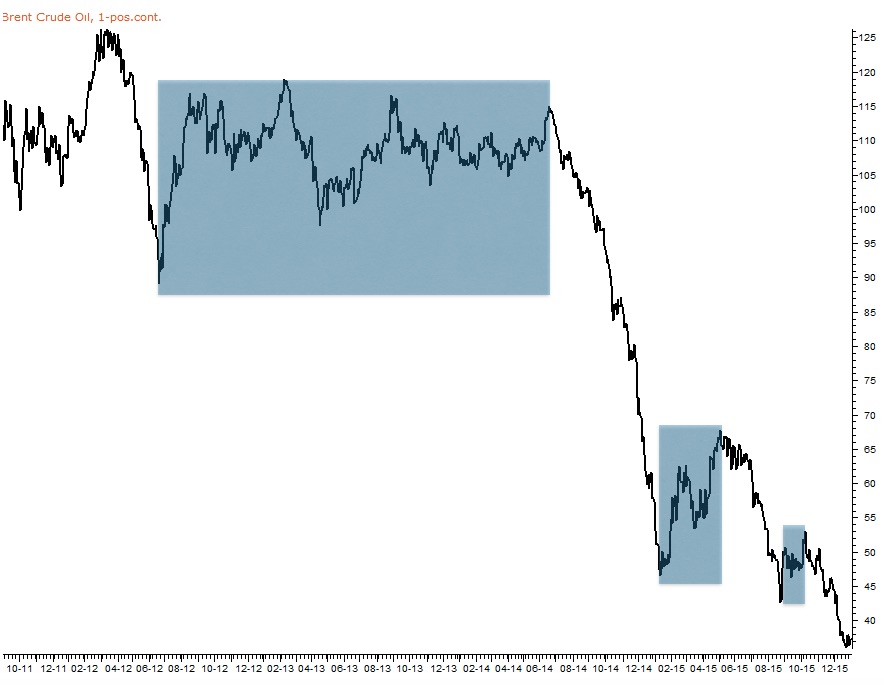
Let's show this with an example. The graph of Brent oil shows that prices have been moving downward in several explosive rocket modes (yes, of course a rocket mode doesn't have to be upward). And the tinted areas show the Bumpy Roads where prices have taken a temporary pause, a winding path (moving upward - in the opposite direction of the Rocket). The main thing to understand is that Bumpy Roads are just a temporary pause before the Rocket mode will continue - in the direction it was aiming for before the pause.
In the Brent oil example there are 3 tinted areas. All of them are Bumpy roads where prices move upward. Everyone of these moves are just a "pause". So we know that the rocket mode will continue afterward. And we know it will be in the same direction as before the pause. So we know the downtrend will continue. This is what we know. It sounds a bit extreme, I know (don't accept the theory, just hang on and assume for a minute that it's true). What we don't know is how long the Bumpy Road will last. The pause can last a few weeks or a few months, which is usual. Or it can last several years, which is what we see in the first tinted area. We cannot know beforehand (not with this technique, anyway, but there's another technique I'd like to share with you in a later blog post).
I assume that you are with me so far (albeit a bit sceptical, which is fine). I have seldom seen anything that can be reduced to only two states, like black and white. I was also a bit sceptical at first when I met the theory, because usually there are a lot of grey areas and exceptions. But during time it's been proven to me, so today I accept it without reserve. You shouldn't accept it until you prove it to yourself, but do try it out. But admit to yourself that you are thinking "Can it really be that simple?". Yes it is. Either the market is moving really, really fast in a Rocket mode, or the market is wandering leisurely in a "pause" where the roads twist and turn all the time, and you cannot see the destination. In a Rocket mode it is straight ahead, no twist and turns.
This is one of the very few instances where it gets better and better the more extreme you use the disticintion. Normally I always warn against "extremes" (one of the Top 5 analytical mistakes, but that is the subject of another blog post). In this case, however, it pays to be extreme. This just shows that there's an exception to every rule.
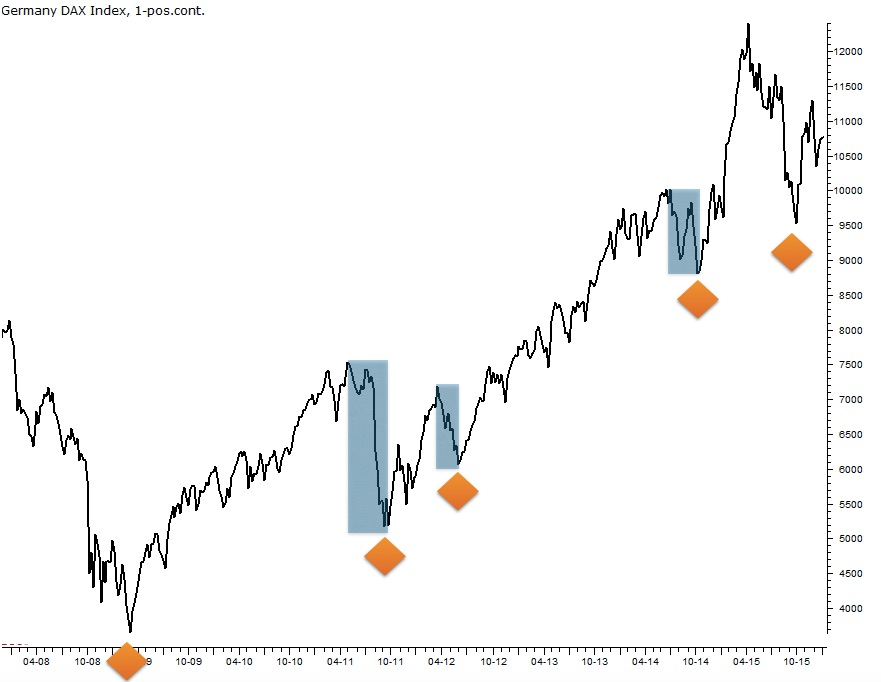
Graph no. 2 shows the German DAX index. Here the Rocket mode has been "up" since 2009 (yes, the rocket can also move upward). There has been an occasional downward movement, but these tinted areas are very short lived and just a Bumpy Road pause before the uptrend continues. So Bumpy Roads move against the prevailing trend.
Don't think about the turning points yet. You are thinking that "at some point Brent oil prices must stop falling, turn around and start an uptrend". Yes, of course. After the turn, the Rocket mode will be upward, for years. And all the Bumpy Roads will be short-lived downward reactions. So there is a turning point (from Rocket down to Rocket up). We will discuss the turning points in a later blog post, because that is not the mission today. The mission today is to "identify whether you are in a Rocket mode or in a Bumpy Road mode right now". Forget the turning points ("tops and tottoms are for suckers and losers" is a common phrase). A turning point is short lived, but look how long the "Trend" last for Brent and DAX. For years the trend is continuing on and on and on. This is where you make the money (not necessarily in turning points). And when the trend is ongoing, it is very helpful to know whether you are in a Rocket mode or in a Bumpy Road mode. Once you understand the difference between these two modes, you get a much more clear perspective:
If you don't like the theory, you can ignore it. Use what you can and discard the rest. But for me it has sharpened my outlook and forecasts knowing whether a certain market was in a Rocket or a Bumpy Road mode. I know what price movement to expect "during" the mode, and I know what to expect "after" the mode is over. And I know that the market continually change between one and the other, over and over.
You'll soon get to know the two personalities of the market. Your own market (stocks, bonds, commodities or whatever) has it's own way to express how Bumpy Roads behave and how long they last. Get to know your own market and its reaction pattern is always a good advice. Now use it.
Let's see if Sweet Sixteen is a Rocket or a Bumpy Road, shall we?