17. January 2016
The long and winding road
I have started playing the piano again. After many years of pause, the reunion is extra sweet, and I really love the piano. Maybe I'll post some more about that. But the link to the topic of today is the music notes that's sitting on my piano. Did you notice how the lines of the music notes resemble trendlines? Musicians have music notes and technical analysts have trendlines. And we each play a song. "The long and winding road" is a great song from Paul McCartney, and it is quite apt today because even though I have tried to shorten this post several times it is still way too long. I tried and failed. Sorry.
After using trendlines for many years - and really liking the results - I once stumbled upon a brilliant analyst, who uses trendlines in a quite different variation. It is really fascinating when someone (skilled) takes an age-old thing that everyone knows...and then turn it into something brand new and totally efficient than ever before. The technique was so brilliant that I adopted it right away and have used it for years. The results are amazing, and I was only jealous that I didn't invent the system myself. But credits are due to the inventor: Jeffrey Kennedy at Elliott Wave International. Thank you, Jeffrey!
Let's start with the two drawbacks to this tool. The first is that you need to be a bit nerdy to study this kind of thing (but that's why we're here, right?). The second drawback is that you'll be convinced that this tool is "too simple". We like complicated stuff that are sprinkled with magic dust. I use a lot of complicated stuff myself, such as regression analysis, co-integration, mathematical models, Bartels test and so on. Very impressive magic dust (at least for the ones who doesn't use mathematics that deeply), but impressive is not always equal to effectiveness. Write that down, please. Sometimes the best tools are simple. Nothing beats a screwdriver when you need it.
The tool I would like to show you - the Kennedy Channeling technique, or the KCT - is a trendline variation. Trendlines are wonderful and I have always used them extensively. I've grown more and more fond of them during the years. Trendlines are seemingly simple tools (I intentionally use the plural sense because trendlines are not one tool, but many, each with it's own purpose - but more about that in a future post). Most people don't know that there are many ways to use trendlines, a seemingly endless set of variations. And you must know the rules and guidelines before you can get a good result. And then they are most astonishingly useful. And this particular variation is especially useful.
This trendline variation comes from the combination/merger of parallel trendlines with Bumpy Roads. Combinations makes things better. Steel is fine by itself, and nickel is fine by itself. But when you combine steel and nickel you get stainless steel that has superior qualities. This is what Kennedy has fused together for us. What is the combination? All analysts know parallel trendlines. Bumpy Roads is something I have described recently - on 2. January 2016 (see the blog about "Rockets and Bumpy Roads").
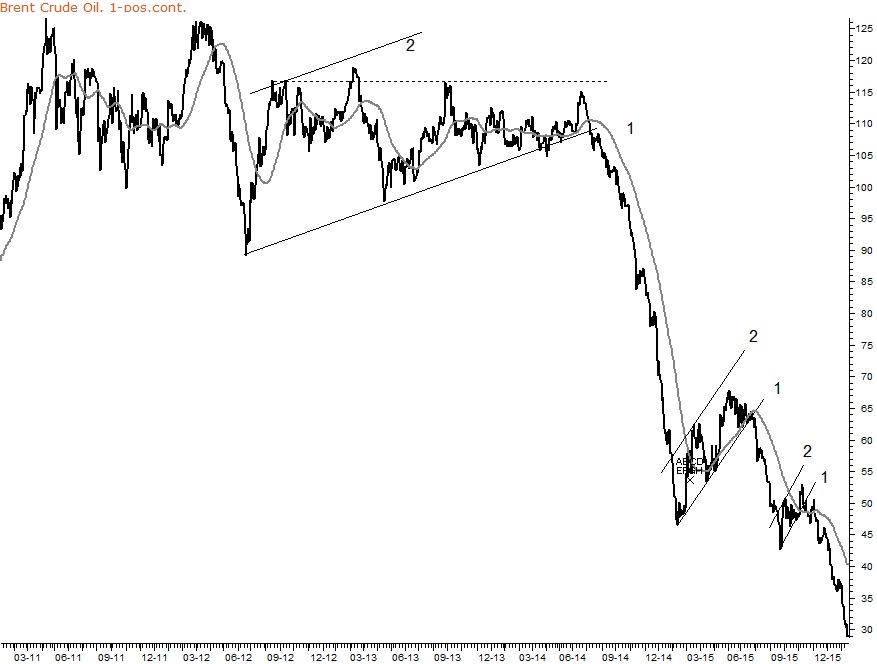
After all this talk, let's go right into charts and see the benefit. "Show me the money" as they say. See chart no. 1 Brent oil. The idea is that Bumpy Roads will twist and turn but stay inside the parallel trendlines. That is the Key ingredient. The Rocket mode is a sharply falling Brent oil price (and boy what a plunge it took). And per definition the Bumpy Roads are all "upward corrections" (going opposite the trend of the Rocket). Notice how chart 1 has three Kennedy channels. In all of them, prices stay inside the channel. The parallel trendlines are drawn in a special manner, but I'll get back to that. The benefits (that you haven't really realized yet, but are eagerly awaiting to hear about) are:
All of them are clear cut advantages, and they can be applied in a real time environment. Regarding chart no. 1 I managed, in real time, to say that these price increases were just Bumpy Roads - i.e. a short lived pause before the Rocket mode would continue again, downward. I could do this thanks to Jeffrey Kennedy and his tool. I could manage to stay away from going massively long, because I knew it was only a short term upward correction. And I managed to not get fooled by false signals in the moving average.
Look at how prices often breaks above the 50 day moving average inside the Kennedy channels. In traditional technical analysis this is the start of an uptrend. But that could be 10 days or it could be 5 months. The moving average doesn't tell us that. But Kennedys tool does. Whenever prices broke above the moving average I could tell that it wasn't worth going long in oil in a massive way because this was only a Bumpy Road.
Now, how do you construct the trendlines? Kennedy is probably better at describing his own tool. I have found a video online where Kenney shows the whole thing in 30 minutes. I don't know for how long the link works, but at least it does for now - so go to: http://www.traderplanet.com/videos/view/114319-the-kennedy-channeling-technique-trader-s-classroom-10/
Despite the video I'll provide a short description: To make a trendline in chart no. 1 you need a low point, and then a "higher low". This is done for all the trendlines named "1" in the graph. This trendline is projected out, and then you make a parallel trendline. This trendline should be placed at the peak (between the two lows you can "look up" and find a peak). This is done for all the trendlines named "2" in the graph. This is the simple explanation. Now you have two lows and a high, and now you can make the parallel trendlines. All price action will be contained inside these trendlines (if it is a Bumpy Road, that is). A break below the lower trendline (as can be seen every time) is the start of the next Rocket downward. Simple, right? Useful, right? I'm using "right" too many times, right? Let me just say that this is Powerful and Simple.
The complex explanation: There are situations where you will be in doubt as to "where exactly" the two lows are, and the top. That will be too lengthy to talk about here, but just know that there's a good perspective on this too. I would really like to show you more, using the tools on higher timeframe and fractals etc. etc., but I want to keep a blog post as short as possible (and I fail, I know :-). Try it out for yourself and you'll get more into the details and understand more. Then let's talk shop.
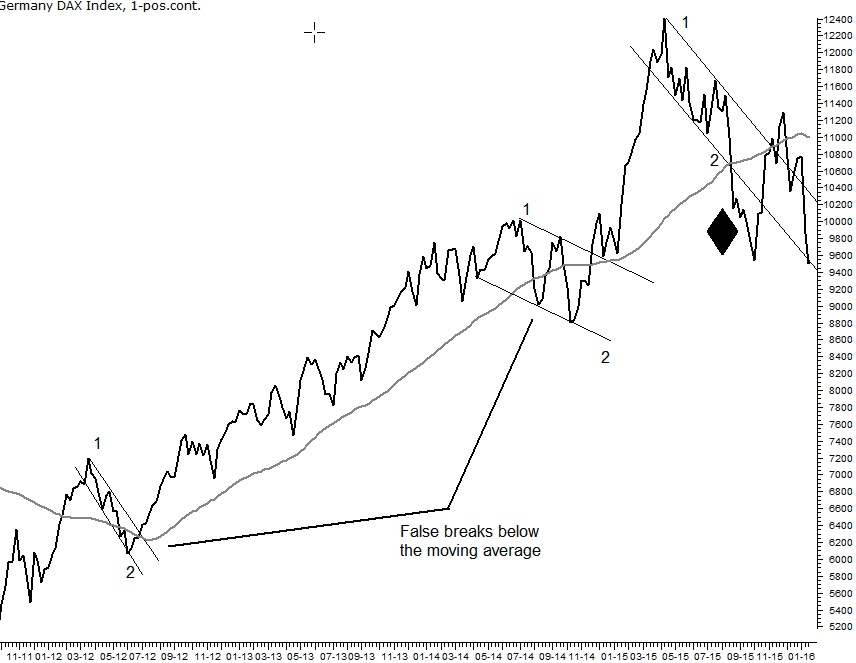
Let's try another example, this time for stocks. The DAX in chart no. 2 shows a Rocket that is going up. The parallel trendlines show a few examples of downward Bumpy Roads. It's the same as Brent, just in the opposite direction. Every true Bumpy Road is contained within parallel lines. Each pause ends with a break above the upper trendline. Then you know that "the next rocket upward" is starting. Simple, right? Powerful, right?
When the Rocket is pointing upward, like in the DAX, you have to draw the parallel trendlines opposite. You start with the top trendline first. You find a peak and a "lower peak". This gives you the top trendline ("1"). Then you make a parallel trendline below, and place it at the low point ("2"). Look at the false breaks below the moving average. We can now eliminate these false signals.
Notice the black diamond in the graph. Here we get a break below the moving average and a break below the lower trendline. This is significant because we now have a "trend change". From the peak we thought that this was just a simple Bumpy Road downward, and prices stayed inside the two trendlines at first. But then we got a break below the lower trendline and this means that this is no longer a Bumpy Road. This is a real turn in the trend (from up to down). And we realize this very soon in the process - actually already when prices break below the 50 day moving average. We don't need to wait for a later break below the long moving average. We know it already.
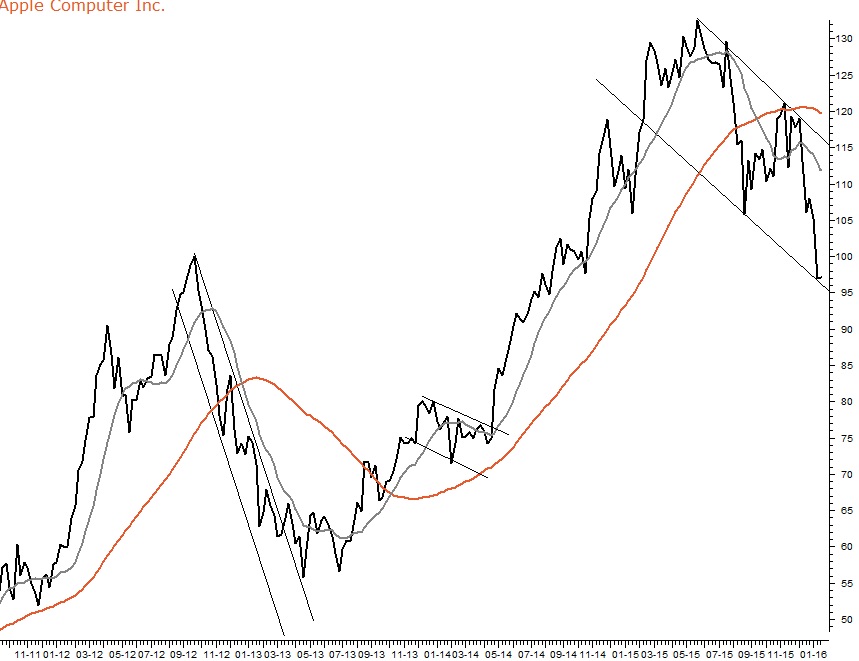
Graph no. 3 shows Apple stocks (this time a weekly chart). The same tool and the same result. The current decline in Apple is still consistent with a temporary pause as a Bumpy Road. But we are right on the threshold, and we should monitor the situation, because a break below will change the situation.
An Elliott wave specialist once said (Refrased somewhat but the meaning is the same): "If prices are not moving like a rocket, then It's a Bumpy road". There's only two versions to choose from. Rockets doesn't stay inside the trendlines.
One last thing: Elliott Wave tells you how many Bumpy Roads you can expect before the whole Rocket trend is finished. There's a certain number. That is worth studying (Elliott Waves) but you don't have to. The parallel trendlines will get you a long way with little effort.
You are using straight lines just like on the piano. Hope you don't think this blog post is too long and winding (it is, I know). But at least you now have been introduced to an excellent tool and a brilliant analyst. The advantage for me is that in future blog post I can just refer to this blog post when I mention the Kennedy Channeling Technique. Then I don't have to explain it again - just point you here. Maybe you are reading this blog post because I sent you here...from a future blog post. Are you in fact coming from the future??