6. feb. 2016
Signature drink
Let me fix you a drink while we look at the stock market crash. It looks like you need it.
The first part of the drink is the “lime”. In this case the stock market. We had a look early December (blog post on 12. December 2015) and the conclusion was that we saw objective signals of a long term downtrend in the S&P and the FTSE. Bad news for stock owners. So the decline we have seen a month later in January 2016 was not so surprising for you after all, right? The DAX also had most of its signal in place in December, but needed one final thing. So let’s see how things have progressed since then.
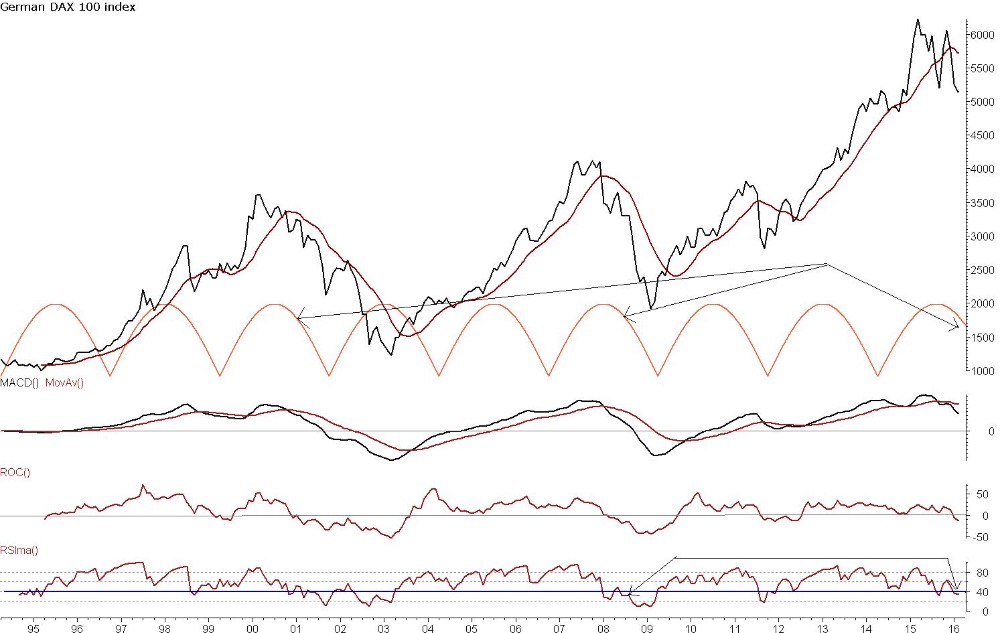
In December the DAX already had a break below the moving average, and that was confirmed by a break below the important MACD. The only thing missing was a break below the ROC zero line. That was missing in December, but it is visible now (see the chart). So the conclusion today is that all the markets in US, UK and now also Germany are in a downtrend.
Before you start to panic please remember that we only performed the Technical Analysis. In December we did not look at the Fundamental Analysis to see if this agreed with the conclusion. We also did not look at the Business Cycle (macro economy). So in our drink we do not focus on the Rum and the Mint leaves. It will be too lengthy to show a full analysis in a short blog post. But I’ll make a future post where I put the emphasis on FA and BC. So right now we are left with only Technical Analysis in this post, but it’s clear that all its indicators agree about the downtrend.
So as mentioned the first ingredient in our drink was lime. This ingredient is pretty bitter for your taste buds. So you might react defensively (if you own a lot of stocks) or your taste buds might be delighted (if you are short in the market). I don't know your taste. There are more ingredients. Here I want to focus on some of the indicators we haven’t discussed before (the RSI and a Cycle) to see if we can learn anything new. Maybe these tools will deny the conclusion we have just made, or perhaps agree with it. Let’s have a look:
Second ingredient is the bubbly soda water
In this case soda water is the Relative Strength Index. I assume that you are familiar with the RSI (after all this is a blog for technical analysts). The only note is that I’m not using the “standard RSI” you find in most TA software. I’m using the original formula that Welles Wilder developed in the 1978. There’s a slight difference, and I prefer the original formula.
The graph shows that the RSI is below 40. We like to see this as an extra confirmation (along with the moving average, the MACD and the ROC zero line). But what I really wanted to focus on is what I call “Signature”. The current RSI has an arrow pointing back to a similar situation from 2008. At that time we also saw a break below the moving average, MACD and ROC zero line just as today. But we also saw the RSI breaking just slightly below 40, and then turn up again (an upward correction). In the end the RSI turned below 40 again and after a short while the downtrend in the DAX became much more obvious and strong. It’s definitely a possibility that we have the same situation today. By following the arrow you can see the similar position then as today, and what happened next. I would definitely not reject wearing a parachute!
Third ingredient is Syrup
Syrup is the cycle I have put in the graph. There are many more cycles, especially longer and more important ones, but I want to make it simple and have a clear chart by using only one. I have an arrow pointing to our current position and comparing it with the same situation in 2008 and also with the stock crash in 2000. Do you see anything similar between 2000, 2008 and 2016? I can only see a pattern that is amazingly persistent and unanimous in its forecast. I don’t see any divergent views among all the tools. If the stock market should follow the orange line to its nadir, then we are looking at a 7 months downtrend - from current position - to a low point in September 2016. That is, of course, only the single cycle and not the complete analysis with the whole spectrum of cycles. But it’s good enough as example for this post.
Here's a quote from Winston Churchill that I often repeat in lectures:
The longer you can look back, the farther you can look forward.
That’s simply what we are trying to do with TA. And the technical tools simply enable us to see the pattern. We can look back to 2008 and 2000 and compare, and it is amazing to see how the moving average, the MACD, the RSI and Cycles point to the same pattern. We are seeing a Signature. That is a unique perspective.
So can we really expect a stock crash now? Well, you decide for yourself (I’m not dictating anything!). I know that history doesn’t repeat itself fully (but it rhymes, as Mark Twain said). And we don’t have the same society and macro economy today as we had in 2008 and 2000, so naturally something will be different this time around. It would be naive to expect the exact same thing to happen. I always look for at least one or two variations to happen (more about variations in another post). But I'm always saying "It’s just like candy". You can get candy with strawberry flavour and you can get candy with orange flavour. Yes, they are different, but 99% of the content is still sugar at the end of the day.
Maybe we should flush the sugar down with a drink now?