19. March 2016
Stock market tango
where are stocks heading now?
The stock market is dancing. It’s our job to feel the rhythm and know the steps of the tango. I’m just trying to understand the dance and here’s a conversation that I recorded the other day between me and myself:
"I'm bloody tired of this indecision in the market. Just tell me the conclusion - is the stock market going up or down".
Well, if you want the conclusion as simple as that, then I would have to say “it's going down”. The DAX and all the major indexes are below the moving average and below the MACD. It really can’t get any more simple than that. At the moment the trend is down.
"Then for crying out loud why has it increased so much during this past month?"
Well, that's the nature of the market. When you start saying words like “crying” that’s because you have “a need” for it do to something specific. You need it to do something “according to your mind”. But it won’t do that. The market is the market, and it won’t do something just to please you. Then it would also have to listen to your neighbour, and he wants something else. So with all these conflicting wishes it would implode in a nanosecond. So instead it is simply doing what it wants to do, regardless whether you are crying out loud or not. So you simply have to adapt to it - not the other way around. But if you want to know the story, it’s fairly simple: It’s making zigzags. It's always like that. 5 steps down and 3 up. That’s what I call 'Rockets and Bumpy Roads' in one of my posts. It's ingrained in the market.
Basically the stock market is like Fred Astaire. The market likes to dance. Five steps down and three up. Spin around and two steps up and four down. It's called dancing. Just don’t expect it to stay like Fred Astaire, because next week it is Michael Jackson. If it just continued in a straight line that would be like marching, like an army walking straight ahead. No, mister, the stock market will have none of that boring stuff. He likes to dance back and forth, and hiphop is just as fine as tango.
"OK, I understand that my first questions were a bit naive. I was just annoyed at the market. So what path is the stock market really going to take from here in your opinion?"
Hmm, so how do I think the dance will progress? I want to first distinguish between Trend and Path. This is where many people get things confused concerning Technical Analysis. They think that TA can forecast the path that the stock market will take in Q2 and Q3 and Q4 of 2016. That is basically wrong. Well, TA can “try” to give an idea, but the real gift and aim of TA is to determine the Trend. And as stated in the beginning, the trend is down. It’s quite simple. All stock market indexes are below the moving average and below the MACD, so we are in a downtrend. When that happened we stopped buying stocks, and we liquidated our portfolio or got short in the market - depending on our time frame and risk profile. Easy and simple. That’s the power of Technical Analysis. But don’t get this confused with an idea that TA is supposed to forecast every twist and turn that the stock market will make from here to Q2 to Q3 to Q4. Where did you get that idea from? In TA we know that a break below the long moving average is often associated with a downtrend of 1-3 years, so we can use that as a guideline. But it’s just a guideline. We don’t know. The aim of TA is simply to notice “the moment” the downtrend is over and a new uptrend is starting, so we can begin to buy stocks again. It’s so glaringly simple - and then we often stumble and end up sprawling on the floor.
But in your last question you didn’t ask me about the “Trend”. You asked me about the “Path” that I think the stock market will take. That is something entirely different. The Path is something I can only speculate about. Let me give an example: A TV station is asking an outstanding analyst (doesn’t matter whether he is a technical analyst or a fundamental analyst): “What do you think will happen with the stock market”. He can only answer about the Trend - is it up or down. Whenever he tries to talk about “how long” the stock market is going to fall, and “how deep” it is going to go, and “what zigzag path we can expect” then we are moving away from Trend analysis and into Speculation. But I like speculation like a good friend. It has got a bad reputation for the wrong reasons, but more about that later.
What you sometimes hear is this: “CNBC interviewed Mr. XY and he said that the stock market is in an uptrend and it should continue to increase for at least two years to level Z. It was clearly wrong. The stock market only increased for half a year, and it didn’t even reach half way to level Z. What a mistake.”
Now you can recognize the difference. He talked objectively about the Trend - which was up. And that was clearly right. Then he talked subjectively about the “possible path and level” that the market might achieve. And here he was only partly right - not wrong as such, but only partly right.
So where do we speculate that the market will go? Maybe it’s surprising that Speculation is actually the fun part. The word speculation has got a bad reputation for the wrong reasons. It comes from Latin and means “to observe”. The implication is “Observation and Contemplation”. So naturally there’s a lot of subjectivity in it, but there’s a keen interest and deep contemplation in it too. Like an Einstein contemplating the laws of relativity. I like deep contemplation, and we should have more of that.
So let me give you my current contemplation about the stock market direction. My contemplation has a few elements of objectivity in it, and a whole bunch of subjectivity, and it is subject to change when conditions change. First of all, I have to assume that ultimately the dance will lead the market lower. As long as prices are below the long moving average, we should assume that prices can continue down. Any break above the short moving average is just a "dance", a temporary upward correction, a clickkety-click of Fred Astaire's shoes. Of course we realize the direction can always change at some point, but for now the direction is still down and there's no evidence to the contrary.
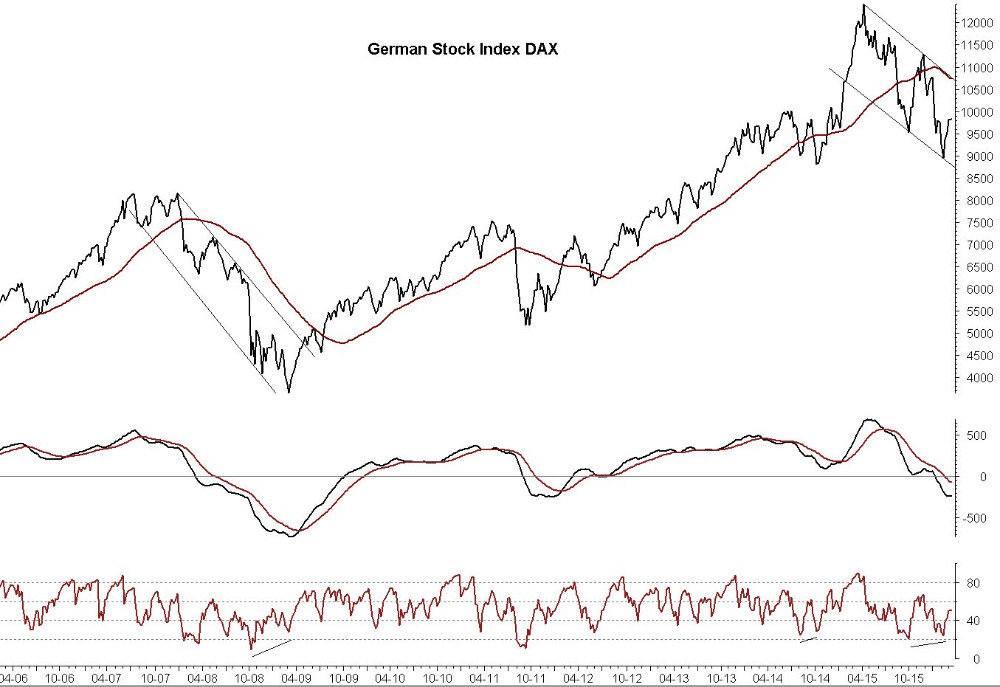
So what about the path, then? First I want to comment on the KCT, the Kennedy Channeling Technique. See the graph of the DAX on the right? There's two descending trendlines (I've written about this technique before) and the DAX is bouncing very neatly inside this channel. This is not something I anticipate or have forecasted. I simply observe it (speculate). The implication is that we are seeing a “downward correction" (or the Bumpy Road that I write about). The direction is still down for now and the DAX can continue to move downward inside the channel - but the implication is A - The downtrend is not that long. B - The index will fall less sharply (not a Rocket) and with lots of up/down corrections, and C - Ultimately we will soon see a new Rocket mode in the upward direction.
A, B and C is the outcome of the trend channel. I was actually not expecting that outcome. I expected prices to break below the moving average (which it did) and simply make a Rocket move down, perhaps like in 2007/2008. We haven’t seen that. It may still happen, but then we must have a break below the lower trendline. We can still get that in the near future, but for now we don't have it, and so we cannot embrace a very bearish scenario - only a mildly bearish scenario.
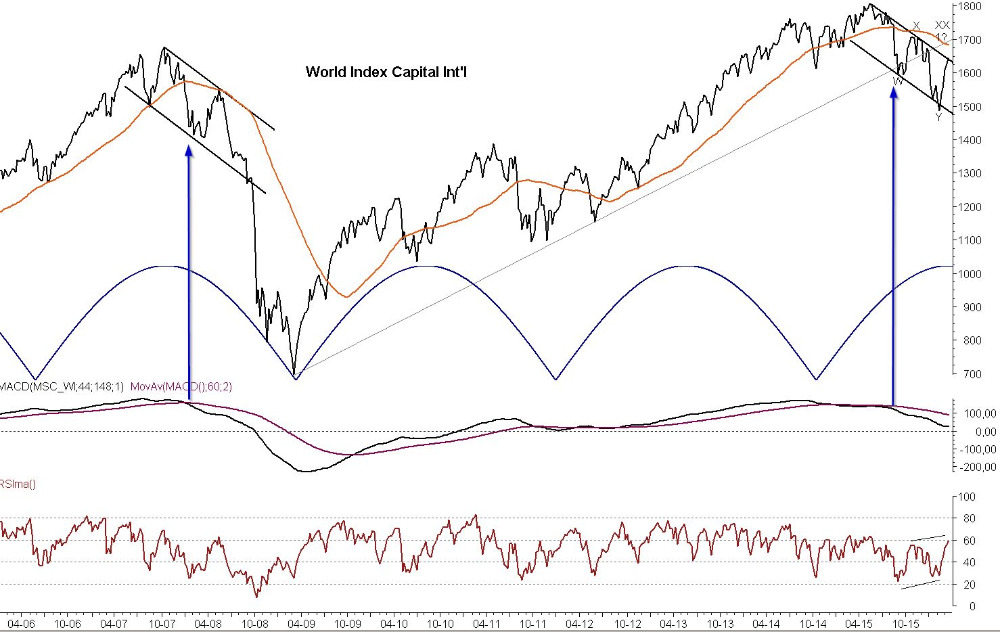
Now, let’s move on to the second graph - the world index. Here we also see the Kennedy channel. So far the price movement has been a WXY pattern as shown on the graph. The world index is right now approaching the upper trendline. That is a potential stopping point. Just a short peek above the trendline would be fine, and that would then complete a wave XX (or potentially a wave 1). If this is a wave XX, then the index should soon turn down again and aim for the lower trendline one more time, perhaps even break a bit below it. That would be my expectation. That is supported by the big cycle I have shown in the graph. The cycle shows that we have seen a top and there is quite a bit of time for the market to go down. That is very bearish. But there's a conflict: The index is staying inside the Kennedy channel (not breaking below the lower trendline) and this is negating the very bearish outlook from the cycle. The Kennedy channel says (for now at least) that it’s ok to have another nice decline to the lower trendline and perhaps just a peek below, but it not “recession bearish”. But at least they both agree that we are still in a downtrend and soon need one more leg down. And that was your question, right?
That was the bearish view (which turned out to be either bearish or recession bearish, but leaning on just bearish). What about a bullish view? As mentioned, the recent month of increase “could” be a Wave 1 (as it says on the graph). If that is true then the increase could continue a bit more perhaps to 1700 (just like in the bearish view), but then it would have to go down in a Wave 2 decline (but only halfway down). So basically the index would stay below the long moving average for some time still (first half of 2016 perhaps). So the break below the moving average in 2015 was basically a good signal of a downtrend. But after the Wave 2 decline, we should then get a bigger increase to Wave 3, and this would break above the long moving average (here in 2016). And that would be the end of the downtrend. That would be a surprisingly short downtrend, from autumn 2015 to perhaps middle of 2016.
The good thing about the above speculations is that we don’t have a “on one hand it could be bearish, on the other hand it could be bullish”. I hate that. Both scenarios agree that A - the current increase during the past month is fully justified. B - The increase can continue a bit longer, but not much. C - Then we need to see a new decline. That is consensus. Then when the next decline is coming soon we just need to observe whether the decline goes all the way to the lower trendline (in which case we have a bearish scenario) or whether the decline stops before that and makes an impulsive increase (in which case we have a bullish scenario). I’m leaning toward the bearish scenario. But the practical beauty of this is that you are simply having no stocks in your portfolio as long as the index is below the moving average, and when we get to the junction where the two roads diverge we can simply buy stocks if the index takes the bullish road.
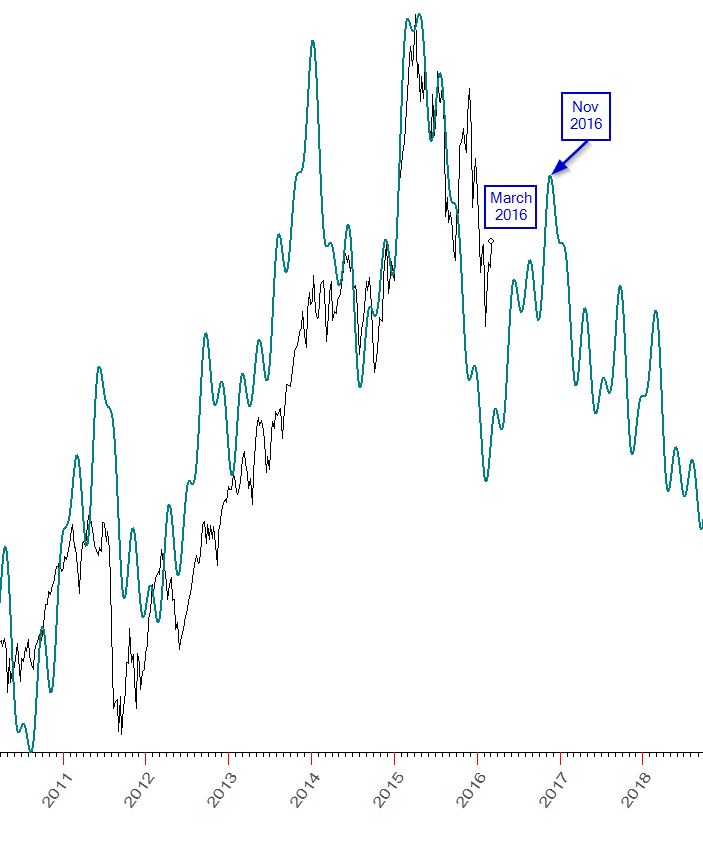
I have included another graph with a green line. If you have read my posts, you have perhaps seen my old joke about “there are two types of people”. One type of people “get this” kind of scenario planning where you see two scenarios following the same path until a certain junction where they diverge. They can use this. The other type of people don’t get this. They think it’s like saying “On one hand, but on the other hand”. They want something tangible they can see. That is the graph with the black and the green line. The black line is the DAX. The green line is a certain forecast technique that I’ll describe in another post some time. It’s not technical analysis as such, but that’s for another post. I just ran the technique to see what perspective this would have on the probable Path.
The good thing about the green line technique is that you can see how it has performed in the past. You can easily spot both the good parts and the bad parts. For example you can see that the quick increase and spike in late 2015 was not forecasted by the green line. So you get an idea of how well it works. The green line seems to anticipate that the DAX will increase until November 2016 (albeit in a zigzag manner). And then from November it will decline in 2017 and 2018. So that is speculation in a third version that seems to expect both a bullish and a bearish development - bullish on the shorter time frame and bearish on the longer time frame.
Normally I have a lot of good experience with this type of technique. This particular DAX calculation, however, seems to have a smaller degree of significance (due to my own fault) than what I normally require as minimum, or would like to see. So with this particular GPS map I don’t want to drive with my eyes shut. I’ll probably work on the calculations some more later this year. I just show it for the benefit of “the other type”. And to give some inspiration that there are other types of techniques that can be used.
So, what was your question again, sorry? Ah, yes, the Path. It seems the current increase can continue only a bit longer, and then we need to see a decline again. And the depth of that decline will tell us whether we have a really bearish scenario, or whether we have a semi-bullish scenario like the green line suggest. I will follow up on this when we get to that junction. But for now the Trend is still down.
Picture in your minds eye Fred Astaire tapping along the dance floor. Listen to the swinging band and the saxophone. See Fred Astaire's feet tapping, stepping, and swooshing back and forth to the rhythm.