10. July 2016
How do you forecast a price target?
The noble art of forecast archery
When I’m doing lectures I often get the question: “How do you come up with price targets?”. It is not simple and straight forward to make a price target so that’s the topic of today. One way, of course, is just to take your bow and arrow and start shooting at those blurry things out there...
Instead of shooting at random, I will show you the tools I use and how I combine them, so you can use it as inspiration in your way.
Not 1 but 4
Not 1 but 4
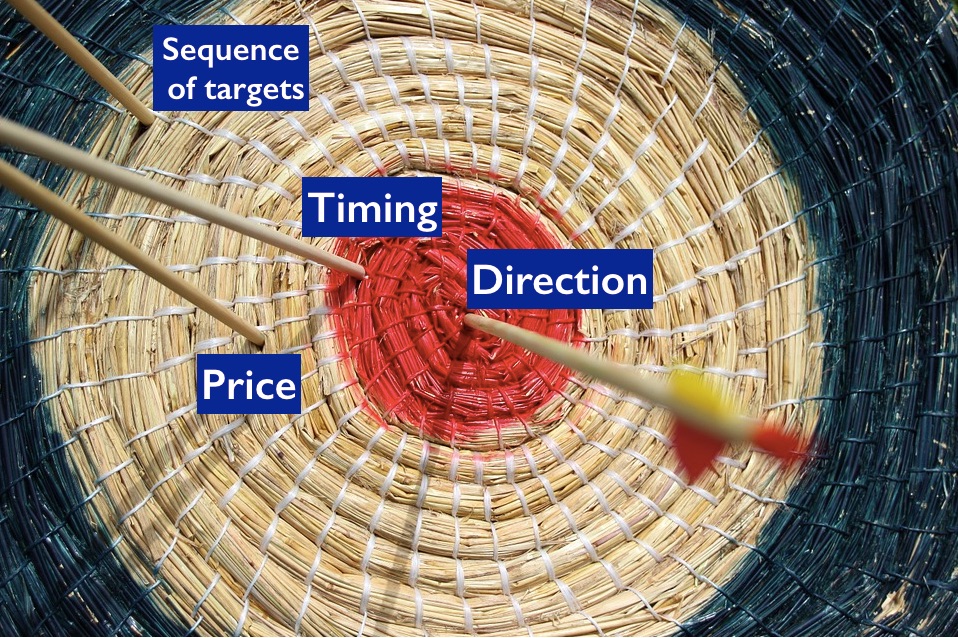
How do we go about making a price target? The first thing is to realize that a price target is not one thing, but four things. If the question was posed the right way it would actually sound like this: “How do you come up with a forecasted direction (up, sideways or down) and with a price target range and a timing target and with a sequence of Target 1 and Target 2 and Target 3?”. Gulp. So a forecast is not just one thing but four, so it is no little feat to make a forecast. This means that we need tools that address all of these four factors.
The four points of direction, price, timing and sequence are not of the same importance! Look at the picture of the 4 arrows. The arrow in the centre is most important and the further out is less important. The level of importance makes a difference in how we treat them. So let’s see how we can make a forecast.
It’s a Zoo out there!!
The first step in making a target is actually not to take your bow and arrow and start shooting. You are not qualified yet. Before you can shoot any arrow you need to study the animal you are trying to hit. Jump into the jeep with me and let’s head out to the savannah. It’s full of lions, giraffes, crocodiles and monkeys, and we need to study your animal first. What is your animal? That depends on whether you study a stock index, a company stock, a commodity, a currency, an interest rate, housing prices or something completely different. Monkeys and giraffes. You need to study how your animal behaves before you have an idea of how it will react in the future.
You study the past history of your instrument to understand the quirks of this particular animal. What is the volatility and how does it usually develop? How many false signals does it have? Can MACD or RSI remove these false signals? How does it change when the fundamentals change? How does it react to macroeconomic developments, to speculators etc? It’s all like finding a new type of lion in a remote mountain in Africa and study it for the first time. You have to spend time studying the lions, and you have to understand their behaviour and how they interact with the group, with the surroundings and with other animals. My heart goes out to one of my true heroes, Jane Goodall and her passionate study of chimpanzees, and her work to make people understand.
Now that we understand the animal we can start to use our tools:
Direction
If you get the direction wrong you lose money, so direction is the most important aspect to get right. It sounds so obvious, but it is not. In a previous blog I showed how a number of banks stated that they had a 97% track record, which impressed me a lot. But then I studied the data. During 1.5 years they all forecasted an increase in price (every quarter they forecasted that prices would increase) but prices were falling instead - continuously. So if you invested at any point during these 1.5 years you would have lost money because the direction was wrong (their high track record came about because they forecasted a small price increase and prices fell only a bit, making the discrepancy relatively small). The tools that can help us show a future price direction are:
Timing
Will the price trend last 3 days, 2 months or 5 years? This makes a difference in the way we trade or invest. Here are some tools that helps us get an idea about timing:
Prices
What price range (minimum to maximum) are we aiming for. Usually people think that the forecasted price level is the most important thing. Naturally it is important whether the increase is expected to be small or big, but if you get the direction and timing right, then you’ve got a winner. And getting a winner is the primary importance. Once you have that, the price target is just so you have an idea of the “possible gains” you are looking at, and whether the upside is big enough for you to start the trade. Here are some tools to determine price targets:
Sequence of targets
We should not limit ourselves to make one target, but to make two or three targets into the future. This is important to get a perspective of the bigger development further into the future but also to understand the fluctuations during this longer time frame. But clearly this is more about perspective than about practical hedging (where target 1 is the more important than target 2 and so on). To make a sequence of targets we can use:
This is the list for now. Perhaps I have forgotten a tool or two, but then I will add them later. It’s nice to have a list of the tools we can use, divided into the four types of targets.
I wanted to show a practical example, but this post is already too long. So I will do the practical example later, and then I will refer to this blog post as the general “tool guide”.
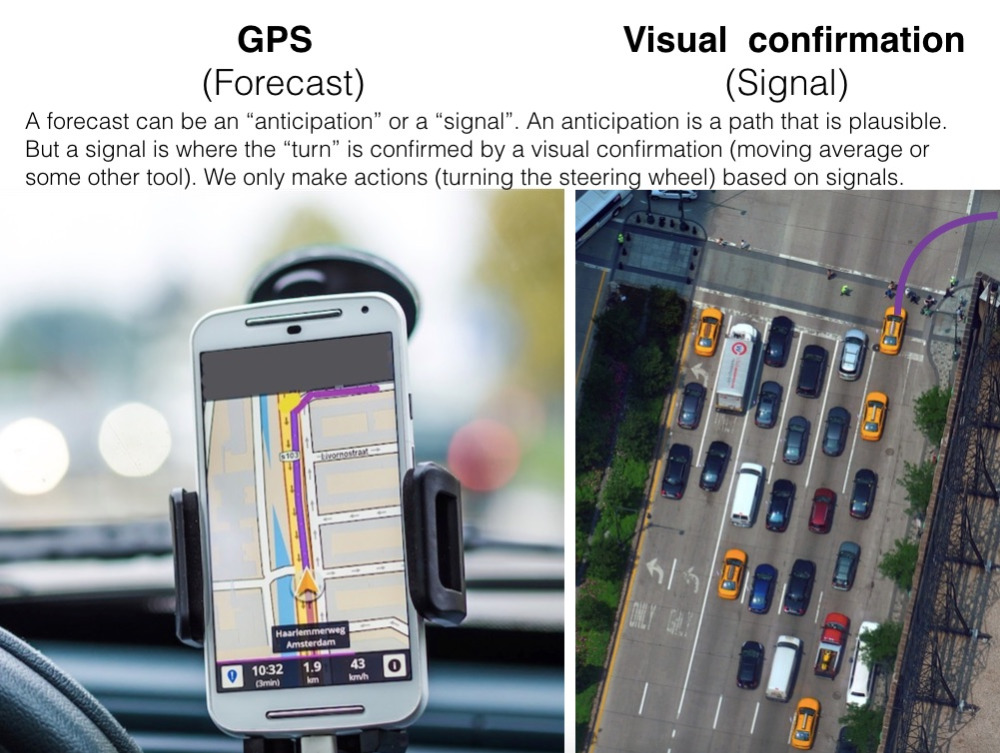
Don’t turn right looking at your GPS!
A truly important point is the differentiation between an Anticipation and a Signal. This is a point where people often stumble. I usually explain that an anticipation is the GPS in your car that shows a right turn 2 miles ahead. You are quite sure that the GPS has a plausible cause in showing you this right turn. But of course you don't turn yet until you have visual confirmation that the road is there, and that it is free, and that the light is green. So anticipations are nice, but you don’t turn right while looking at your GPS. You want the visual confirmation. So we can forecast many years into the future using anticipations, but each turn has to be verified by a signal before we act on it. See the picture on the right.
Many tend to look at a forecast without making clear whether forecast target 1 is an anticipation or a signal. Huge difference. My point is: When you make forecasts you have to show whether your target 1 is an anticipation or a signal.
The Crime Scene
The real fun starts when we begin to use the tools in conjunction with each other. It is like being a detective where we have to put each puzzle piece in its logical place and sequence to make a coherent story line, like being at a crime scene and putting all the clues together. The detective needs to understand what happened at the crime scene. He looks at all the clues, fingerprints, DNA samples, broken locks, overturned chairs and then he makes a storyline of first this happened and then that happened. He combines the pieces into a coherent picture. This is like building a storyline into the future (not a past crime but a future crime). A storyline that looks plausible and make sense, where each tool has its place and level of importance in making a plausible direction, price, timing and sequence. To make such a story line is part science and part art. A big part of this is tool based, but parts of it is based on experience and on the ability of the detective.
So how do we put these tools together in a sequence that makes sense? Well, there is no proven, scientific way, but I can share the way that I do it. I have a sequence to it and you can see how in a video I made earlier
Cycles
At this point I was about done and was going to wrap this blog post up. But I was thinking that perhaps you could be a bit overwhelmed at the task. I mean, there is sure a lot of tools to keep track of and not everyone makes it their full-time job to be a detective. So I thought why not show you a short-cut?
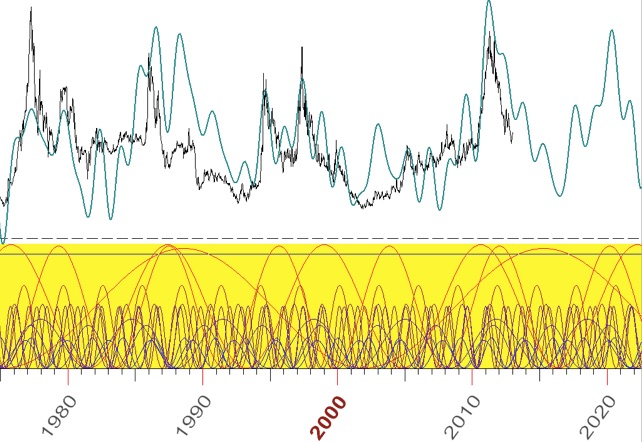
My short-cut and a major tool in my tool box is Cycle analysis. I mentioned Cycle analysis in the list, but that doesn't show the importance I put on this tool. I have a mission to make people aware of how powerful Cycle analysis is. That's for a future blog post. But right now the best way is to show a practical example. I’ll do this very short because this blog is already quite long. But look at the Cycle analysis graph to the right (it’s a commodity, but that doesn’t really matter).
When you study the graph you can see the forecast (green line) projected 9 years into the future. This is what Cycle analysis gives you. And you can see how the cycle calculation matched up with the real price back in time (remember that we are looking at no less than 40 years of history back in time here!). So looking forward you get direction, you get timing of coming peaks and lows, you get an idea of the price range we can achieve and you get multiple targets. So basically we get all four things in one tool. And very few people even knows about Cycle analysis, and even fewer know how to make it. It’s actually a quite mind blowing tool once you start to work with it, and I just love how you get a full forecast into the future. Of course, I still want to make sure that the fundamentals and the technical analysis confirms the story line. But I get a big part of the work done with just one tool. More about this in the future. This is just a short glimpse.
As you can see it’s all about building a coherent story from multiple lego blocks. So analysis is just like playing a game. If I have to drag a plan out, giving me a mental headache, then it’s usually wrong and comes from overthinking. It's like being a kid in a sandbox again. I’ve found that a really good analysis is often played into existence. Discernment, art and science playing together...