20. July 2016
Arm wrestling with the US stock market
Is Europe og the US stock market going to be strongest in the 2nd half of 2016?
You have likely noticed already that the S&P is at all time highs, whereas the European stocks and the DAX are perhaps 20% or so below their previous highs. This is a big discrepancy that I have not seen before. So I did a quick test and was surprised by the relationship between US and EU, and I wanted to show you this. So which of the two boys will win the arm wrestle in the 2nd half of 2016?
The question is not who is winning right now. Clearly the US is much stronger, breaking to new all time highs whereas the DAX is very weak. The question is how this will unfold in the 2nd half of 2016, but also: If the two indexes should get closer together, will it be the DAX increasing or the US falling?
I’m stronger than you
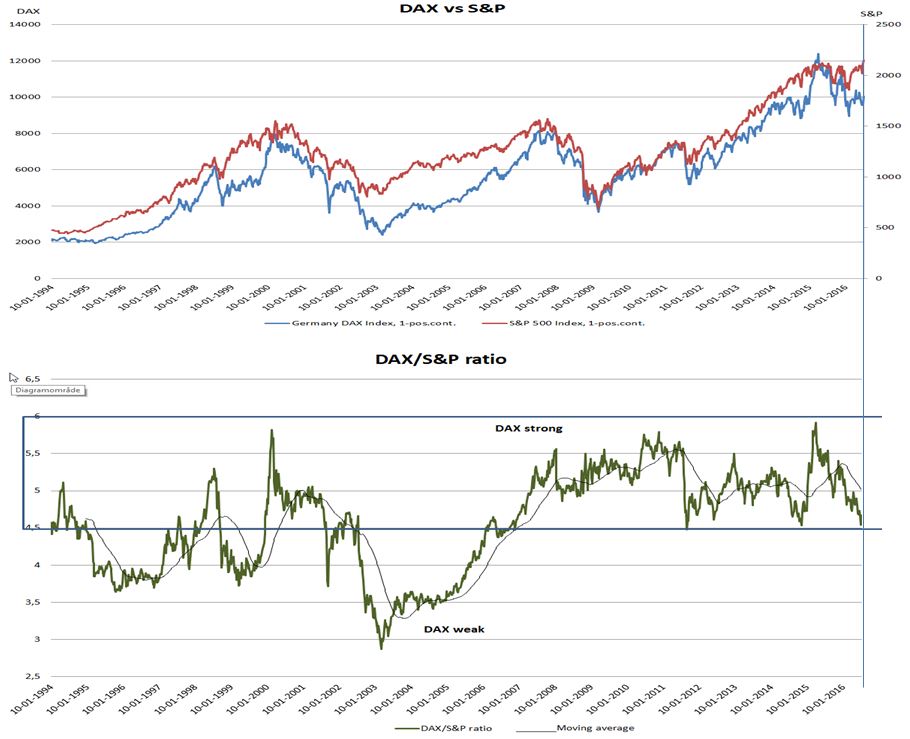
The first graph shows the S&P and the DAX over a 22 year period (on two axes for comparison). They follow each other quite well. They both make lifetime peaks at roughly the same time, so the current disjoint between them is actually a rather rare phenomenon. That is why I wanted to check the strength ratio between them, and that is where I was surprised. See the lower end of the first graph where I have divided the DAX with the S&P to get a crude feel for the strength relationship.
The blue box at the top shows a “strong DAX”. The lower part shows a “weak DAX”. Right now we are in the middle - and that was the surprise. I thought that the US at unprecedented highs was phenomenally strong and the DAX really weak, but that is not the case. The DAX is right in the middle of the normal strength relationship in the past 22 years, and I didn’t realize that until I made the graph.
Two conclusions
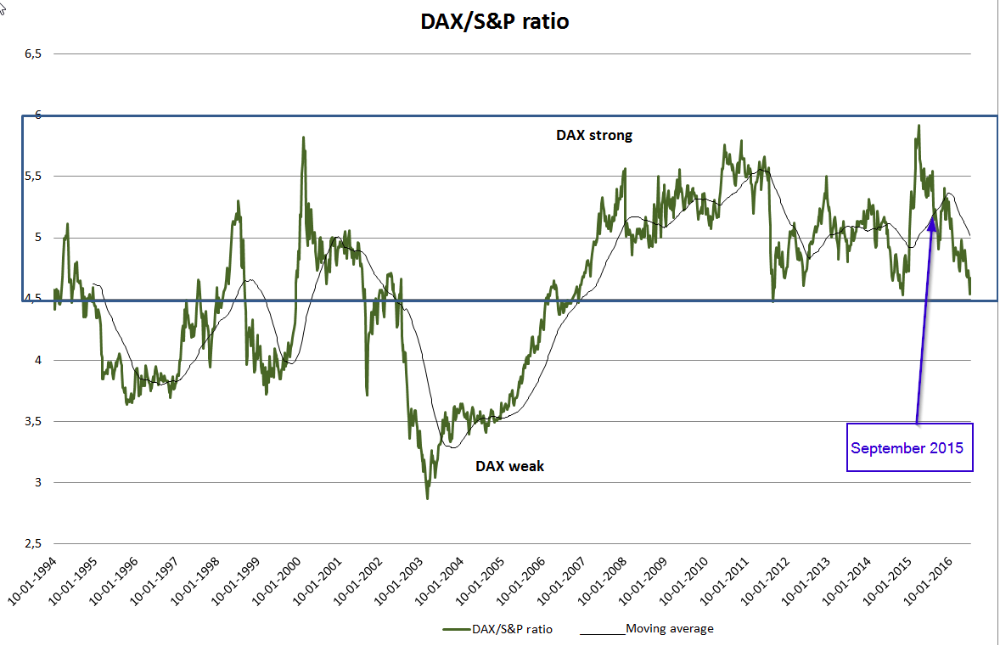
In the next graph I only focus on the strength ratio, and there are two clear conclusions and takeaways:
Flying or falling?
The final question you have now is: “What if there is a turnaround (“if”) and the strength ratio should start to increase: Would it then be US stocks falling to the DAX level, or would it be the DAX increasing to the US level?”. Good question. Darn, you got me there, because the ratio doesn’t tell. Ratios are really nice, but they don’t give away the secret of the future, and you of course know this already. Both options are fine from the perspective of the ratio. A third option is also fine: If the US declines a bit and the DAX increases a bit that would also do the trick. So all three options are open. But it is clear that something has to give as it is very rare for US to reach all time highs and Europe to be 20% below their last highs. This is a big discrepancy.
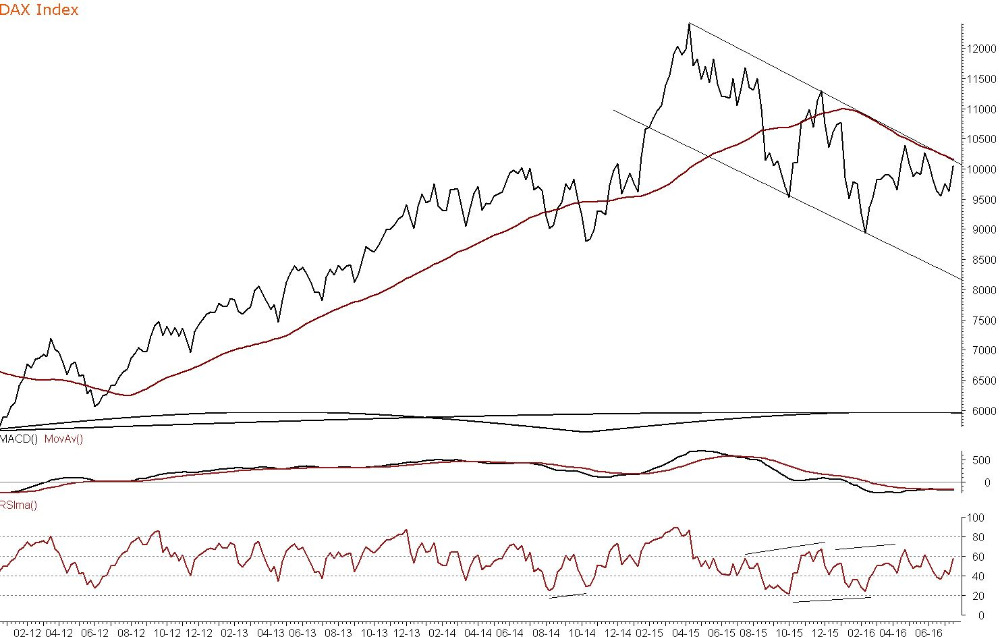
The last graph simply show an updated picture of the DAX that I have shown before. The DAX is still contained within the two trendlines, and this is a downward correction (a temporary downward correction and not an outright downtrend). A break above the upper trendline would change this to an uptrend, but we do not have that yet. The S&P is still in an uptrend above its moving average (not shown), and a break below the moving average would change the uptrend. So we are simply standing at the beach, looking at the two boys in the sand to see who wins the arm wrestle. Have patience: You don’t have to put your money on either boy until you see one of the two levels I mentioned give way. Just enjoy the breeze and the sand below your feet…but don’t take your eyes off the two hands for too long.