17. November 2015
Is your slice bigger than mine?
At birthday parties when I was a boy we always kept a keen and close eye that no-one got a bigger slice of cake than we did. And if a friend got a toy, we wanted it too. We always compared. I ran the sprint distance at 12 seconds and how fast did you run? But at home we were always told that "we should not compare". However, today I'm going to say that it's fine to compare...in the world of financial analysis. Don't worry. It's OK to compare, despite what your mum told you.
Let me give you the conclusion right off the bat. When you do "comparisons" you will not get the holy grail, but you'll get something to think about. Or, said in another way: You will not get a "leading indicator" but you will get some "perspective".
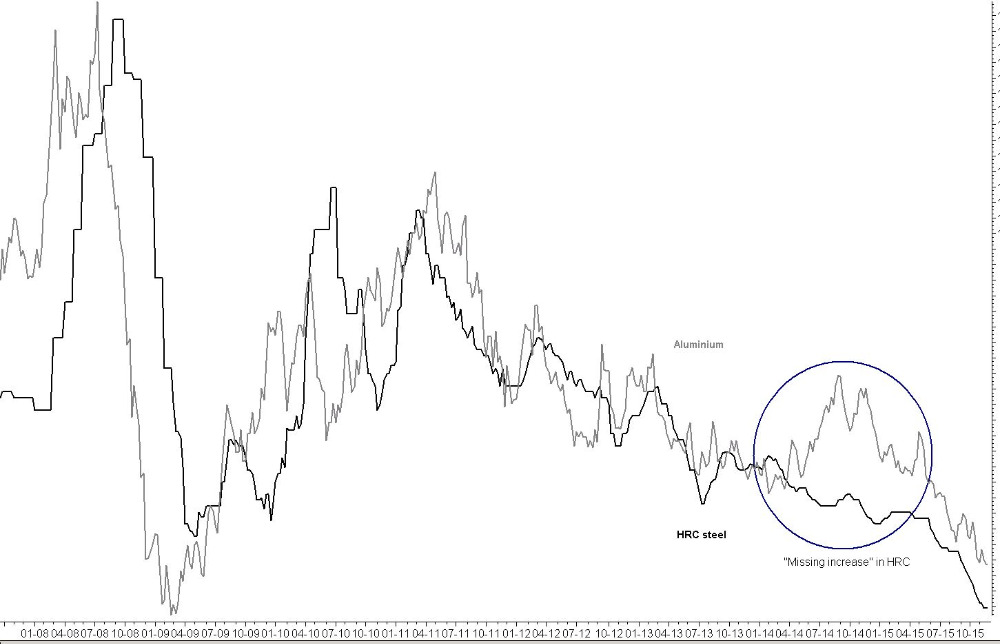
Let me give two concrete examples. The first is a graph of aluminium prices versus steel prices. It's rather amazing to see how well they fit together. They are obviously connected via the general macro economy that influences everything, and also connected by both being a metal that is used in cars and construction etc. But despite these common things, we are still talking about two very different metals, applications and especially very different cost drivers. Nonetheless they show an amazing similar price curve over many years. The "perspective" we get in this is that most metals are more closely linked than one would normally think, and this is a good basic understanding to get. In this particular case we even get a bit of "leading indicator" (the thing I said you wouldn't get). There's a tendency for alu prices to sometimes "lead" or start a movement a month before steel prices. So if you are interested in steel, you can watch aluminium prices and get a lead start. This doesn't give you a lot because there is only so much that can happen to prices in a month. But still it's fine. The major benefit is the realization that they follow a common path. So if you "big thinking" is right, then all metal price movements will more or less fall into place. Of course, if your big thinking is wrong, then you get it all wrong, but that's just how it is. The benefit lies in the fact that you don't have to work on "big thinking" for every single metal, ending with 10 or 20 different forecasts. Most likely you will make one major "big thinking" and this will work for most metals. When I say metals, the same applies to stocks of a certain category, to bonds in a certain category etc. This text isn't about metals, but I'm sure you already figured that out. The comparison also allows you to watch dissimilarities. I've marked one with a circle in the graph. Aluminium and a lot of metals saw a price increase that I forecasted, but hot rolled coil refused to go up. I called this "the missing increase". So prices are not glued together. But the difference in aluminium and steel is then obvious and it gives you food for thought. "Why are they behaving differently now, all of a sudden"? So it gives you perspective. Not necessarily the answer, but perspective.
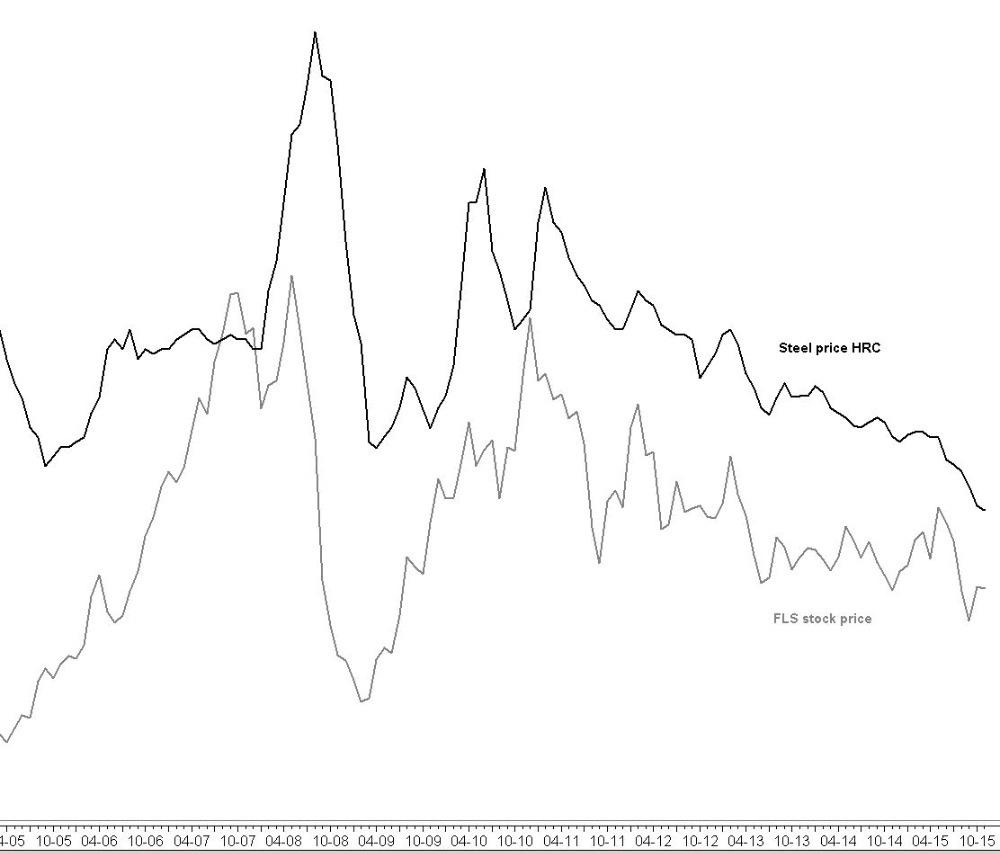
Another comparison is needed in order to get away from your concern (that I have telepathically picked up on) that "of course metals are going to be quite similar,". But you're just saying that because you are already ahead of the curve. Which means you are also making the same comparisons I'm making, because you also like a bit of perspective and "big thinking". So let's try another comparison. I was recently asked in a TV interview to comment on a certain stock price. A lot of analysts were discussing the outlook of the company, the new management team, the recent cutbacks and innovations they had launched. A lot of hubbub and speculations and weighing for and against. It made my brain tired. So I suggested to simply compare the companys stock price to a commodity price. This is the last graph, shown to the right. The commentators were stunned that the stock price was so "glued" to the steel price. To me it was simply a case of these two following the same track for years and years. I wasn't claiming any "causality" between one and the other. Only a correlation. And my point simply was that I didn't want to invest in a stock price like that as long as steel prices are falling. You can talk all day about the new management team and innovations, and this will matter relatively, but not absolutely. So I just wanted to make it easy, and the correlation between A and B explained a lot more than all the fundamentals put together, and it has kept me out of trouble - not buying the stock. So now we are not talking "metal price vs metal price" any longer. We are looking at two wholly disconnected things, but seeing a correlation.
So you are not getting any cake (leading indicator), but you are getting some perspective. Your "big thinking" is now even more important than before, because you'll get everything right (or everything wrong) according to the quality of this. That's something, isn't it? But I know. I feel the same way. I would also rather have the cake :-)