7. November 2016
The Crash of the Super Commodity Cycle
The magic trick of forecasting
I will show you a method of predicting the really big, long term stuff, and I will show you how relatively simple it is.
To make the method more real, I will give you a concrete example. I will show you an old blog, that I wrote in 2011 about the Super Commodity Cycle. The method can be used for stocks and currencies and all sorts of things, but this specific example is about commodities. I wrote the below text in 2011 (but not posted here, as this blog was not around at that time). I would probably have written it slightly different today, but for the sake of accuracy I need to print it here as it was written originally. Fortunately it's short.
2011 blog post:
One of my former colleagues once had a thing about the word ”price”. Every time a person said that this was an “expensive price”, he always corrected that person. “A price cannot be expensive,” he would say. "It cannot be expensive or cheap. A price doesn’t cost anything, and so it cannot be cheap. A product, on the other hand, can be expensive or cheap. A price can only be high or low". That leads me to commodities. Out of consideration for my former colleague I will not say that commodity prices are “too expensive”, but that they are “too high”. During the last 4-5 years commodity prices has climbed to amazing heights. In the international media they have called this phenomenon a “Super Commodity Cycle” and there has been speculation as to how long these price increases could continue. But this Super Commodity Cycle has now been broken in the same way an ocean wave is breaking. The wave has grown very big, but now we are heading the other way. I know that some euphoric analysts and commodity producers are arguing that this is just a temporary pause before a continued increase. But I don’t buy that. Commodity prices have had an unusual large increase for a long period of time, but now it is over (for now). That is the destiny of a wave. A wave in the Atlantic Ocean cannot grow until it reaches the skies. There are natural laws that govern this. Our task is just to know where the wave is heading – and it is heading down. They say that not two waves are identical, and the same applies to commodity waves. This Super Commodity Cycle has its own unique DNA and fingerprint, but no price waves – regardless of their DNA or uniqueness – can break the natural laws. That is why ocean waves do not grow until they reach the skies.
…and just to follow up on my introduction...my own pet craze is when people say “chance” when they mean “risk”. What is your craze?" End of blog post, 2011.
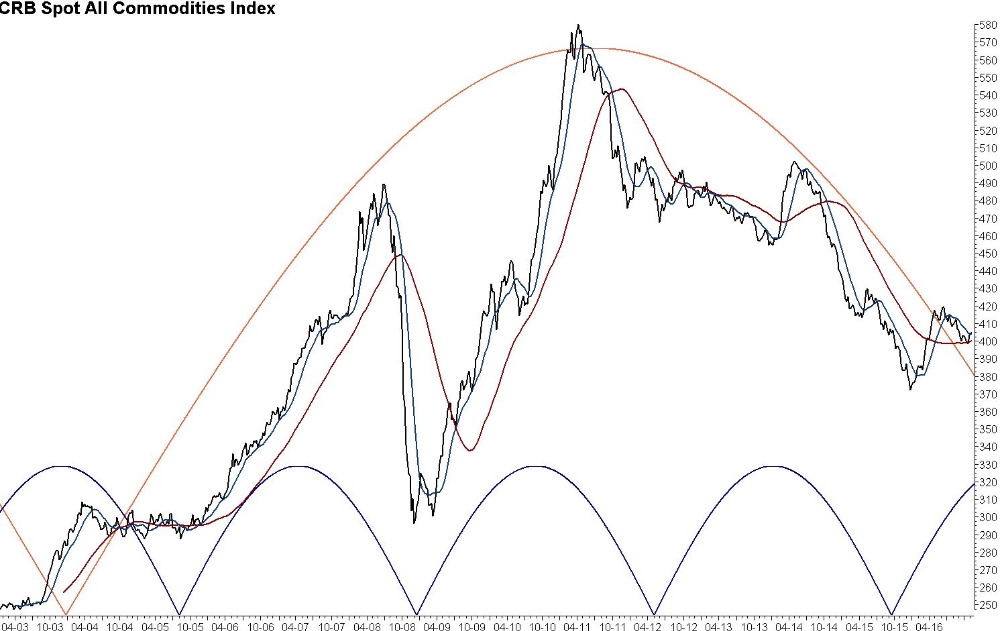
Let's now turn the clock from 2011 to 2016. OK, I'll gloat a little by saying that the forecast and thinking was right. It's amazing to see prices fall for more than 5 years in a row. The commodity price wave did in fact reach the peak back then and the wave has been heading downward from 2011 to 2016. The chart on the right shows that. That is the CRB commodity index. But my point is not to gloat, but show you the tools that made this forecast. And when you see it, you will realise how easy and simple it is. And that will turn me from Mr. Superforecaster into "OK, anyone can do that". It's like when you see a very intriguing magic trick, and then they reveal how it is done. So simple, that even a 5 year old can do it. And when you know how the magic trick is done, you can do it yourself.
The magic trick I did in 2011 is revealed here: I used Cycles, as in Cycle analysis. See the graph where I have made a long term wave cycle (the orange cycle). That is commodity prices (the CRB commodity index) along with a big cycle. See how this cycle predicted a price decline back in 2011, to continue in 2012 and in 2013 etc. etc.
It's so simple!
Just play along for a moment. Let's just assume that we believe in the cycle I show in the graph. We don't have time to go into proofs and validations in this post, so let's just assume that we have known about this cycle since 2006 and that we believe it to be accurate. We'll get to proofs and specifics another time. But my point is: The sheer simplicity of this cycle is staggering. Assuming we believe this cycle is valid, then in 2011 it was childs play to write the blog that I did. It was so simple that anyone could have done it. So I was actually no Mr. Superforecaster after all. It was dead easy to see that the wave is going down in the future and that it will continue to go down for years to come. The simplicity of this is actually mind blowing. And that's the perspective we get by using Cycles. Then comes all the footnotes that I will show another time (that we don't work with only one cycle, but many smaller cycles like for example the blue cycle in the graph, and that they have to be calculated in the proper way et cetera and so forth and what have you). But the point is that once we have calculated a real cycle, it is totally simple.
Are you hot or cold?
I can show the simplicity in another example. Let's say you are in summer, and it's really hot. Then let's suppose says someone ask you: "What is the trend during the next six months of the daily temperature curve - from now until Christmas?". Would you need to do very advanced mathematical calculations and forecasts? No. You know, of course, that the current high temperature in summer will not last until Christmas. So you give him your forecast that the temperature will have a gradually falling curve until December, and probably even into a January low. And you got it right! Wow. But you see, that's how simple it is when you know the cycle of the temperature curve. It should be equally simple for everything else.
Now, don't get me wrong. I cannot predict what the accurate temperature is going to be on 7. September. That particular day could be any kind of temperature. Naturally the temperature will consist of a myriad of zigzags, going from hot summer to cold Christmas. We are not after predicting what a single day or week will look like. That is not our aim. We simply know that investing in a rising temperature will be a losing game from summer, and so we stay away from spending all our money on this stock, knowing its future trend. It is that simple. And the conclusion is, if cycles are that useful, why don't we simply start to employ them more?
I didn't create the cycles. I don't know who did. But I can use them. I won't refuse a wonderful insight simply because I don't know what makes it work. But you will hear me rant from time to time about cycles because of their beauty, simplicity and because they are effective. I would like to write a new book (the second) about it, and perhaps develop a course. Maybe I'll do a bit of it all. I just know that Cycles are crucially important, and that any work we do (whether we are technical or fundamentally oriented) is wholly incomplete with regards to the big picture if we don't include Cycles as a part of what we already do.
We are in November now, and we had a really great summer with a terrific September temperature like I have not seen before. But it's getting cold here in November. Darn, the cycle continues to work. A few months more and we are at the low of the cycle and can look forward to the next upturn. When are you going to use cycles in your forecast?