21. May 2016
The stock market elevator - “going up or going down?”
The DAX, The DOW, The S&P and the OMX
It’s time to see where the stock market is heading. Not because “something has happened”. In fact, the opposite. The market is sort of sideways and undecided now. I hear many talk and discuss where the stock market is heading. Even among professionals there is no clarity and no obvious right answer, and people speculate about all directions. So sometimes we just need a no-bullshit-update. We don’t need to be 100% certain and totally convinced, but we need some kind of perspective and clarity. So I’ll have a look at the DAX, the DOW, the S&P and the OMX.
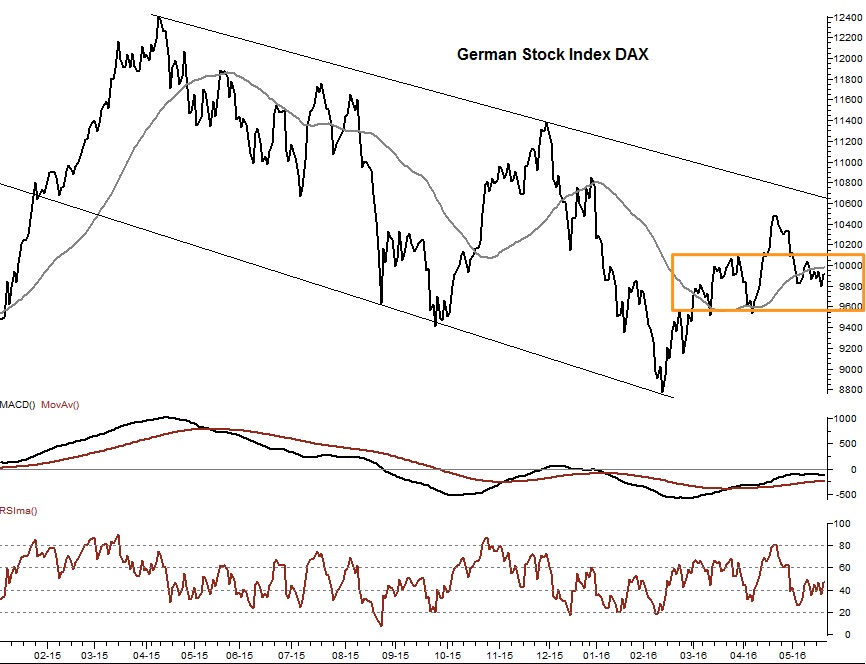
The first graph of the DAX (daily prices) shows a few weeks of “nothing” during May. I have drawn an orange box that shows the current sideways range. We need to see a solid move out of this box (either up or down) before we have anything concrete to go on. Until then we can only speculate. So here are my speculations:
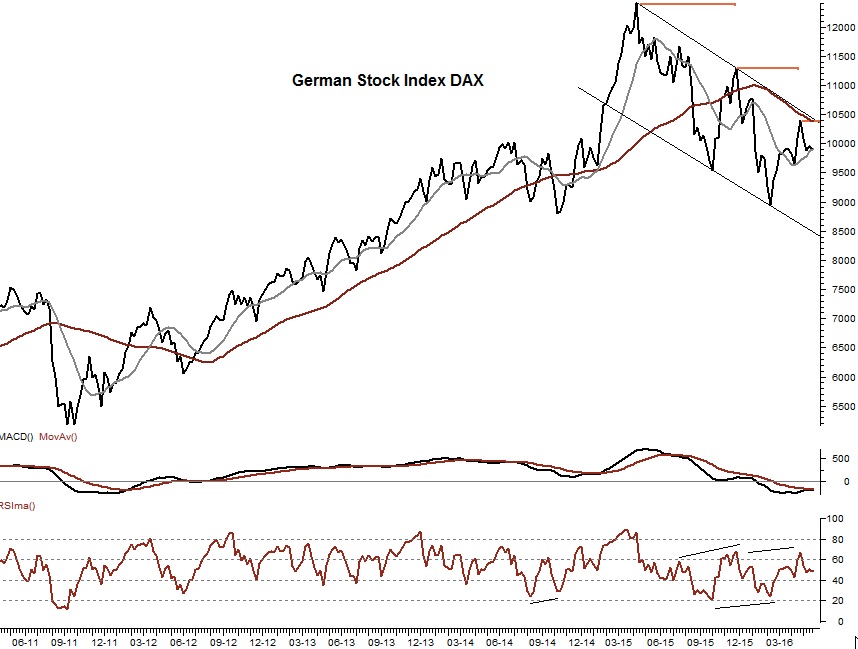
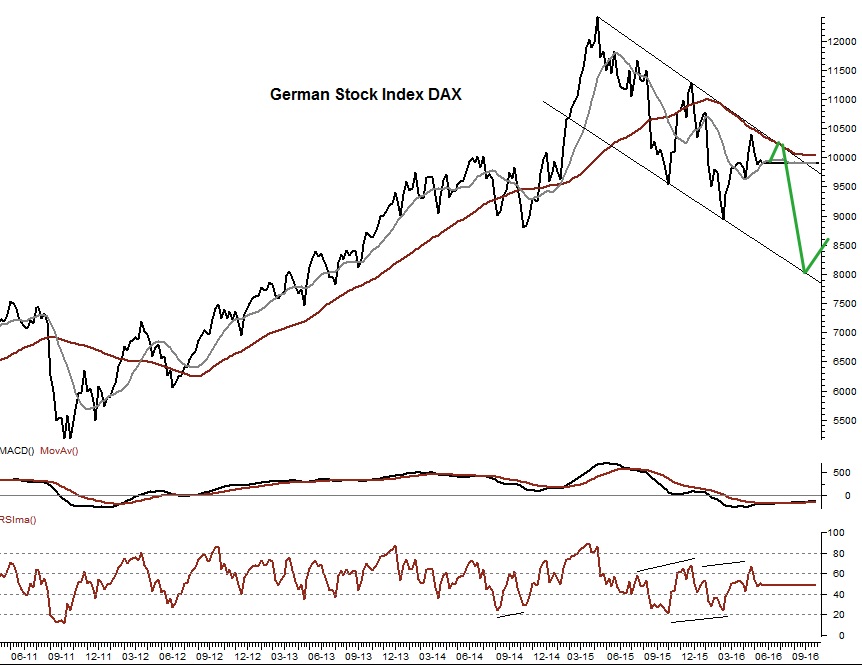
In times of uncertainty it has always helped me to step back to get a bigger view and then keeping it very, very simple. That’s the recipe. A bigger view and going back to basic. The next graph is the DAX on a weekly chart (stepping back). Looking at the graph there are three things that become apparent right away, and each of them are simple and basic rules:
1. The DAX is below the long moving average (the red line). Don’t fret about the short term moving average (the grey line). The DAX is still below the long MA, and that is a downtrend.
2. The DAX is making a series of “lower highs”. I have drawn three orange lines that are horizontal. It’s clear to see that each top is at a lower level than the previous top. That is the back-to-basic definition of a downtrend. Lower highs and lower lows.
3. The two black trendlines show the channel where the DAX is confined. As long as the DAX is falling inside this channel we have a downward correction. Not necessarily a long or fierce downtrend, but at least a downward correction with numerous bounces. And as long as the DAX holds within the channel, we should expect the overall decline to be intact.
The conclusion of all three points seems to be that the DAX is still in a downtrend. That can obviously change at any point, even tomorrow, but so far the downtrend is still intact and ongoing. From a long term perspective we sold all our stocks when the DAX broke below the long moving average. Period. A short term trader could well have bought stocks for the short term because the DAX is above the short moving average, but these stocks needs to be sold again the next time we see a break below the short moving average.
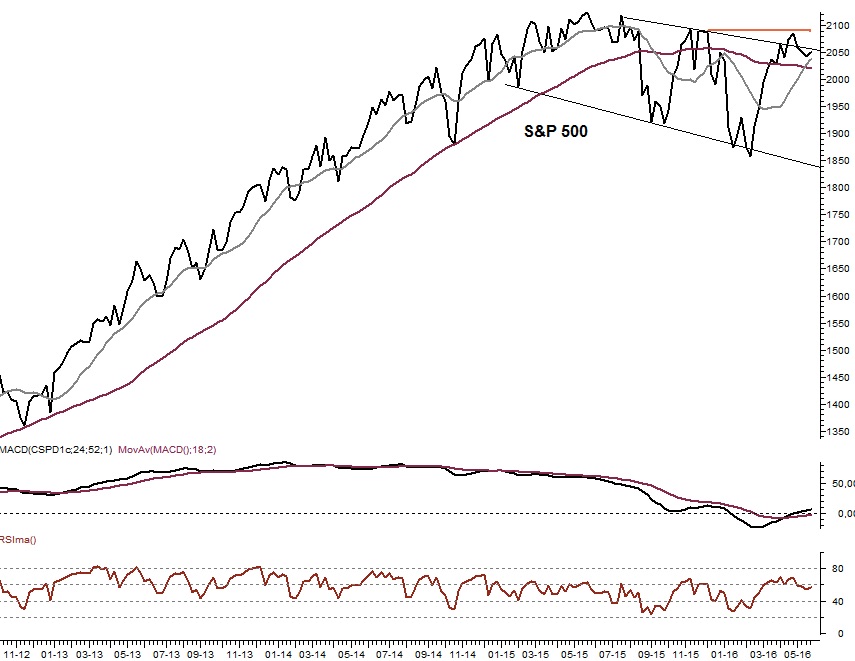
That was the DAX. How about the US stock market? The S&P 500 is also showing lower highs (recent peak is lower than the previous - see the orange line). But now things get different. The S&P 500 is not below the long moving average (and not below the MACD). This indicates a textbook style sideways trend. In a sideways trend we often see several breaks above and below the moving average (lots of false signals) and this is clearly visible in the S&P 500. The S&P 500 broke above the upper trendline in spring, but is now falling back again. This means either getting back inside the channel or making a bounce off the trendline in new increase. The outcome is radically different, so keep monitoring. The decision is likely to come before summer.
The conclusion is that the S&P 500 is in a clear sideways trend (a contradiction in terms as a sideways trend is seldom clear). From a long term perspective we can keep our stocks, and the same goes for the short term. The only requirement in a sideways trend is that we monitor the movements very closely and are ready to act once the market makes a clear decision between an uptrend or a downtrend.
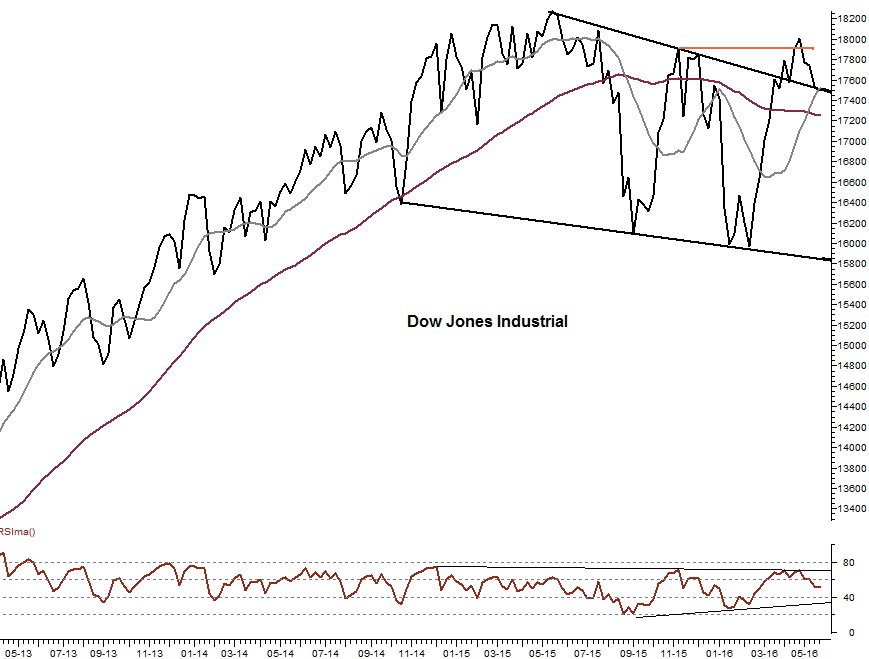
The DOW looks pretty much the same as the S&P. There’s a little bit of difference, but the overall conclusion is the same.
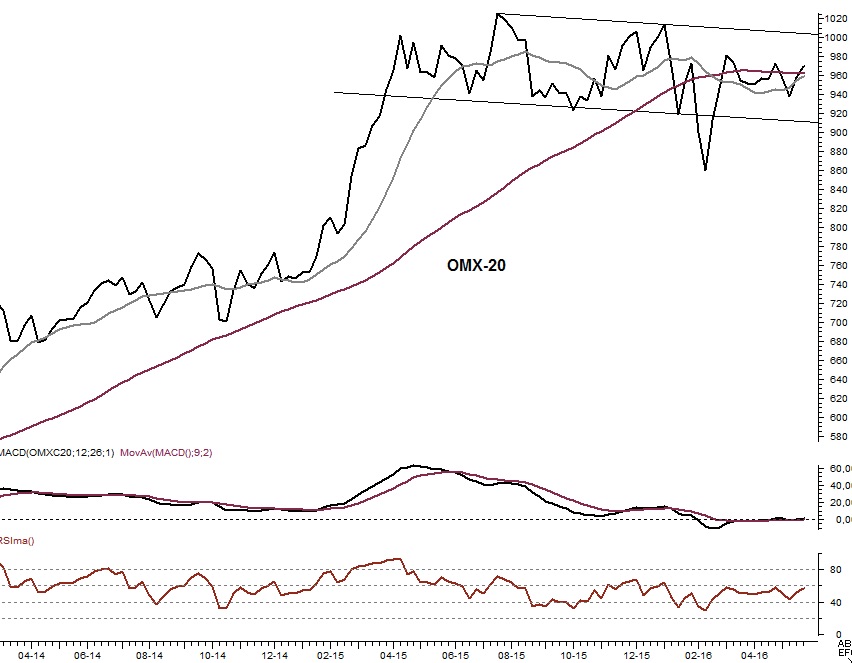
The Danish OMX index is not at all important from a European or US standpoint. I just want to include it (not because I’m a Dane, no) because the OMX has increased a lot more than most indexes, and so I wanted to see whether it behaves differently right now.
The graph of the OMX shows pretty much the same conclusion as the S&P 500 and the DOW. The sideways trend is very apparent with a lot of whipsaws and fluctuations that are very busy getting nowhere. So here we also need to keep a close eye on the market when it decides on the next trend. Right now it is clearly unresolved. But given that the much bigger brother DAX is in a downtrend, the risk is definitely high if you are having stocks. An unclear sideways trend and a high risk because of Germany means that it is your risk and hedging profile that determines your action. The only requirement is that the development is followed very closely.
The very last graph shows a conclusion that I have shown before. It is not a forecast as such (although it certainly looks like it). It is just a pragmatic result of stepping back and having a basic view at the chart. As long as the DAX is below the moving average and inside the channel - with lower highs - the main scenario is the green line. We can certainly have some small fluctuations on the short term at current levels, but in our planning we must at least include one of the scenarios as the green line.
When the markets make a decision, I will do a follow-up.
I did say that it has always helped me to step back to get a bigger view. But I didn't mean it literally :-)